Creating a report
A report in Deem Insight is a drill-enabled analytical view of your data. You define dimensions, measures, filters and layout so that the report shows the information needed for insight and decision-making. This guide explains how to create and configure a new report.
Deem Insight supports drill reports. There are two main categories of these reports, “periodic” and “all data”. The main difference between these categories are how the measures are grouped.
| Periodic | All data | |
|---|---|---|
| Filter | Should contain a period selection | No specific requirements |
| Measures | Measures should be grouped in periodic groups (YTD,TP etc) | No specific requirements |
| Zero values | Null/0 values might appear because dimension exist, but not in selected period | No specific requirements |
| Dimensions | No specific requirements | No specific requirements |
To create/modify reports, the user must have analytics administration access. You need to create a connection and data sources before you can start building a report. The reports can either be edited from a report by choosing menu and edit, or you can find the report in the “admin” section:
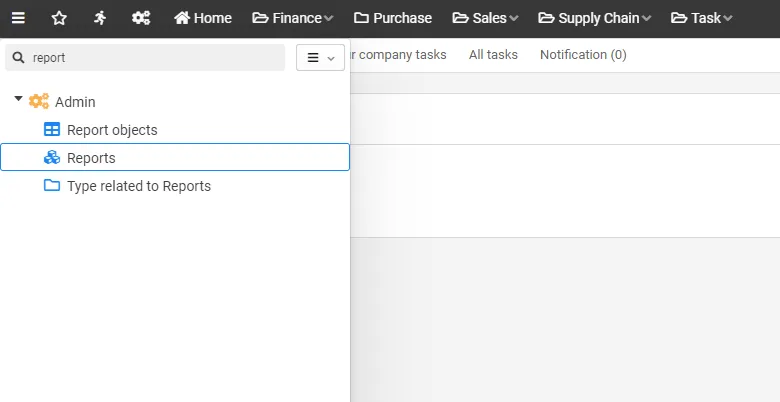
- Open report administration from the admin menu to create and maintain reports.
- This view lists available reports and their status.
The report management is divided in several tabs, each explained in the following chapters.
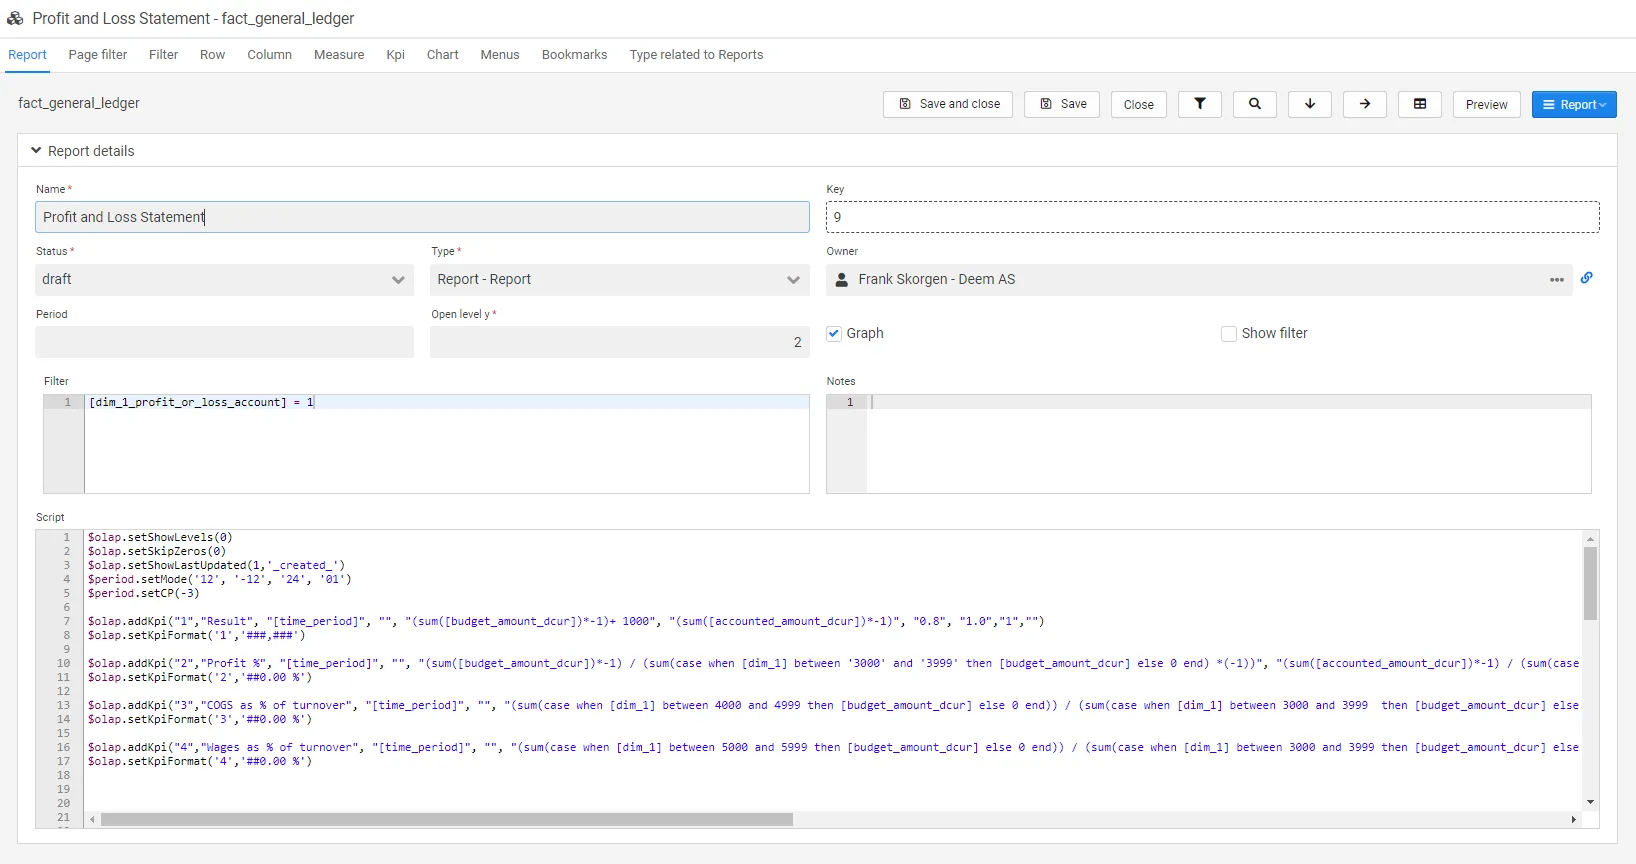
- The main report editor is organized in tabs for each configuration area.
- Configure settings first, then continue with row/column/measure/filter tabs.
Report settings
Section titled “Report settings”| Field | Description |
|---|---|
| Key | Report key. |
| Name | The default report name (but can be changed when adding it to the menu). |
| Type | Currently just “Report”. |
| Status | Set the status of the report (statuses can be configured). |
| Owner | The report owner (select from users). |
| Period | |
| Open level y | Number of levels opened as a default for the report. |
| Graph | Show/hide graphs. |
| Show filter | Show/hide filter. |
| Notes | Freetext field. The text will be shown in the report’s help button. |
| Filter | Filters all content in report, graphs and KPIs. |
| Script | All report/graph/addon table/KPI functions are set here. |
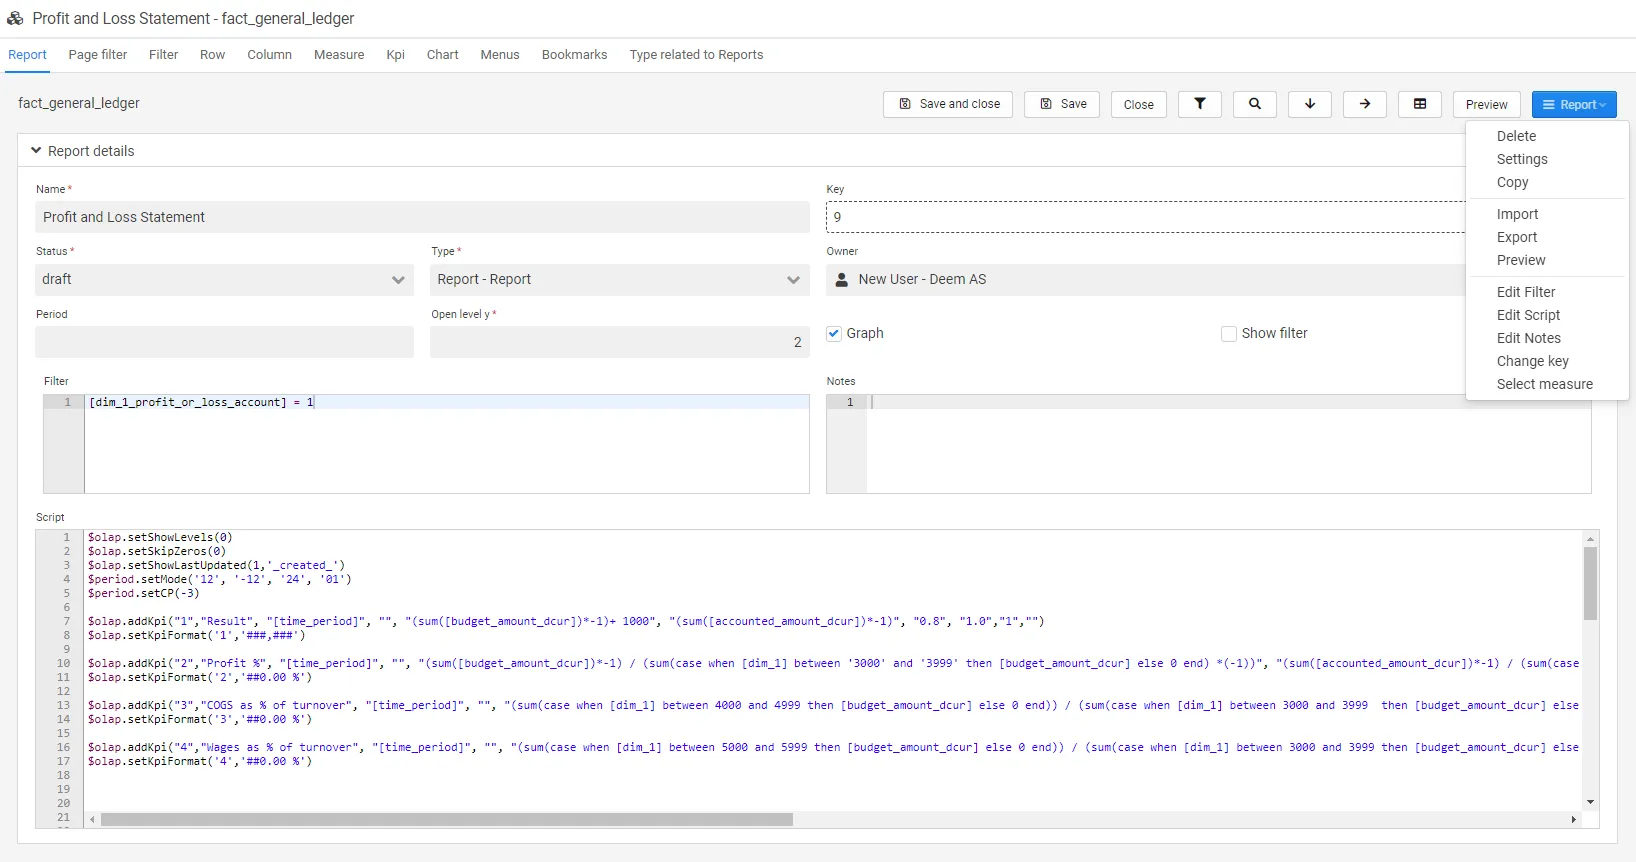
| Field | Description |
|---|---|
| Copy | Copy the report. |
| Delete | Delete the report. |
| Import | Import another report. |
| Export | Export current report. |
| Preview | Preview the report. |
| Edit filter | Opens a new window to edit the filter. Contains help functions for scripts. |
| Edit script | Opens a new window to edit the script. Contains help functions for scripts, colors and icons. |
| Edit notes | Opens a new window to edit the notes. |
| Change key | Change the report key. |
| Select measure | Opens a select measure box. |
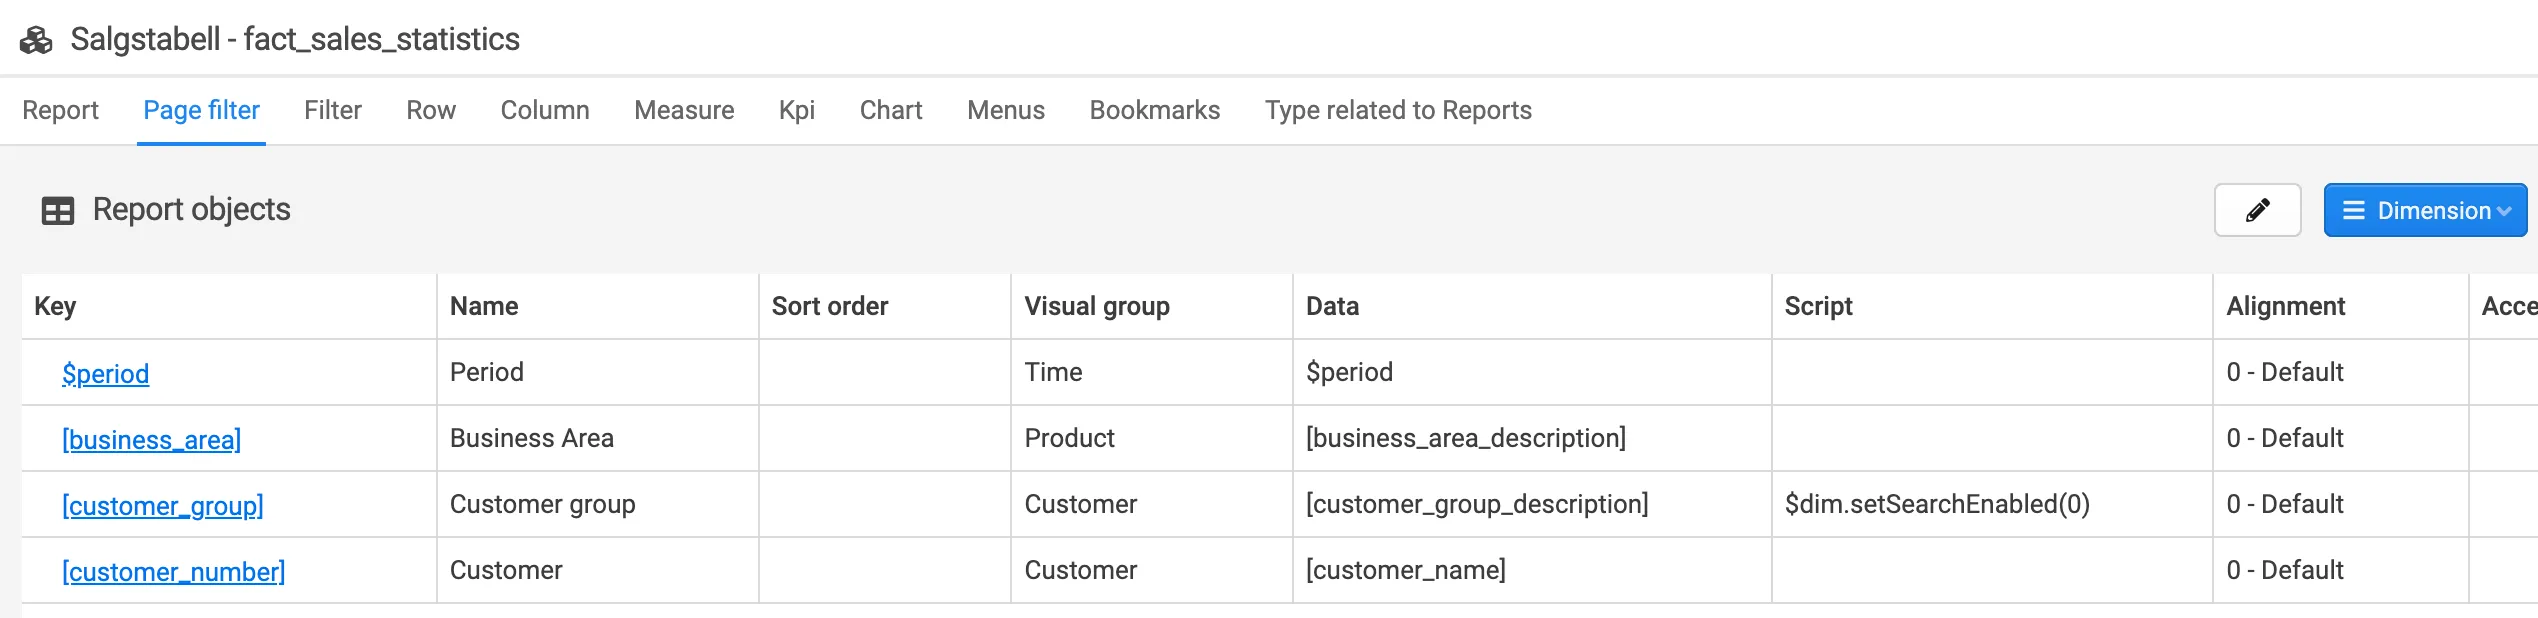
Page filter
Section titled “Page filter”Page filters provide quick access to frequently used filters directly in the report view. They make it easier to adjust the report without opening the full filter panel and are especially useful for dimensions that are used often.
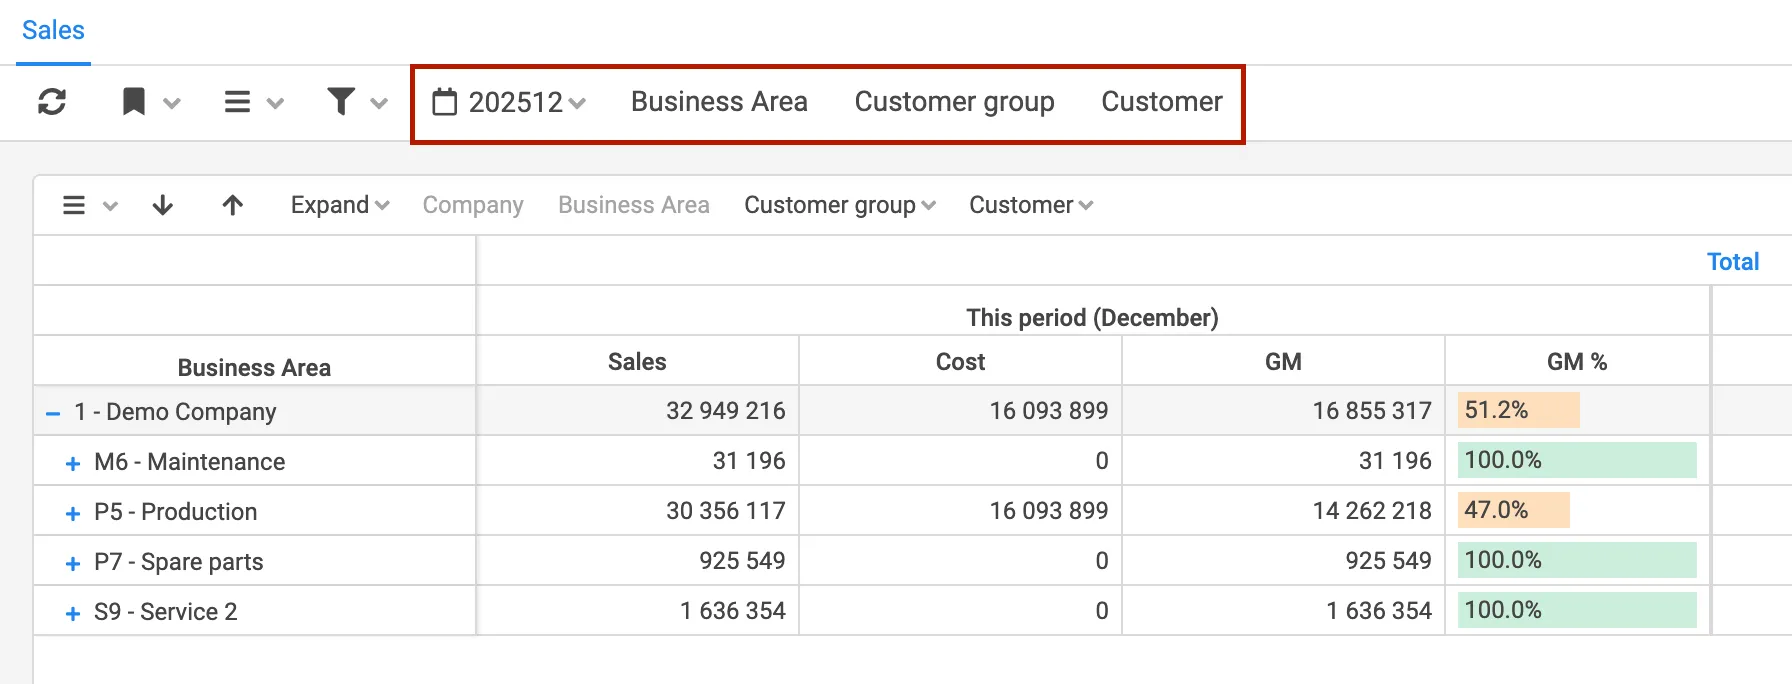
All dimensions that are included in the dimensions can be used as page filters.
1. Open the report you want to customize2. Select Menu → Edit3. Click the Page filter tab4. Add dimensions you want as quick filters5. Set defaults or script behavior if neededOnce configured, the selected page filters will be visible directly in the report view and can be adjusted by the end user.
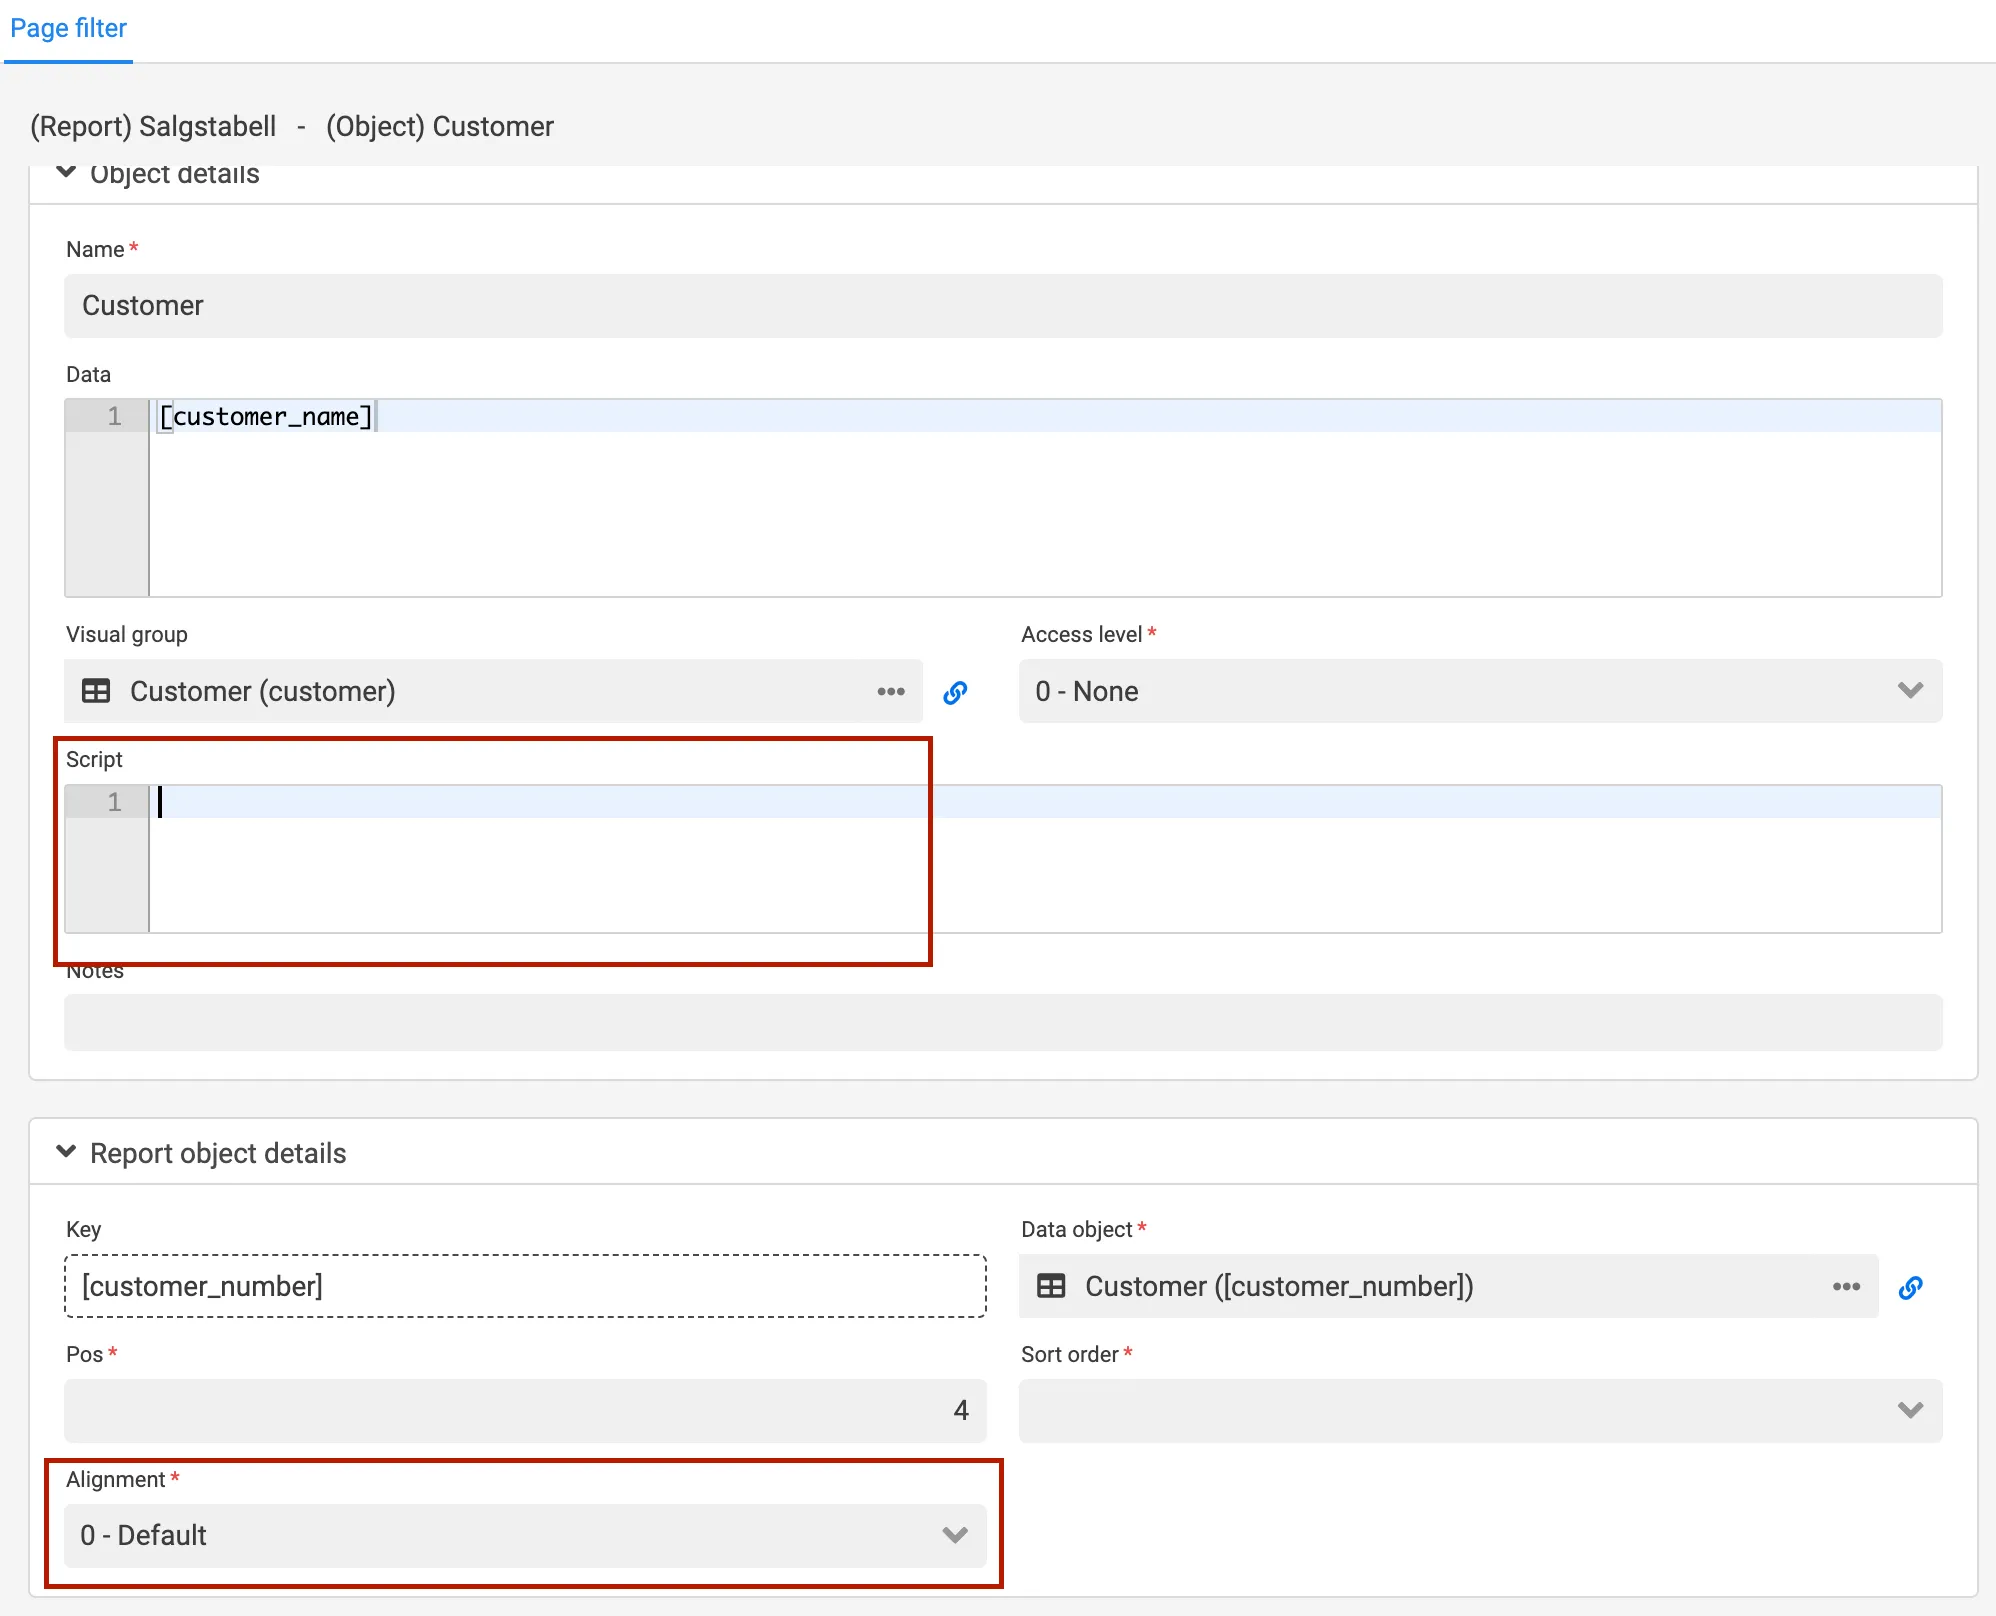
For each page filter, it is possible to configure additional behavior.
You can as an example:
- Set default values so the report opens with predefined filters applied
- Add scripting to control filter behavior
- Choose where the filter is displayed in the report, for example at the top, left, or right side
These settings allow page filters to be adapted to different report layouts and usage patterns.
You can apply changes either globally or locally within a report object. Changes made under Object details will affect all reports using this dimension. Changes made under Report object details will only apply to the current report.
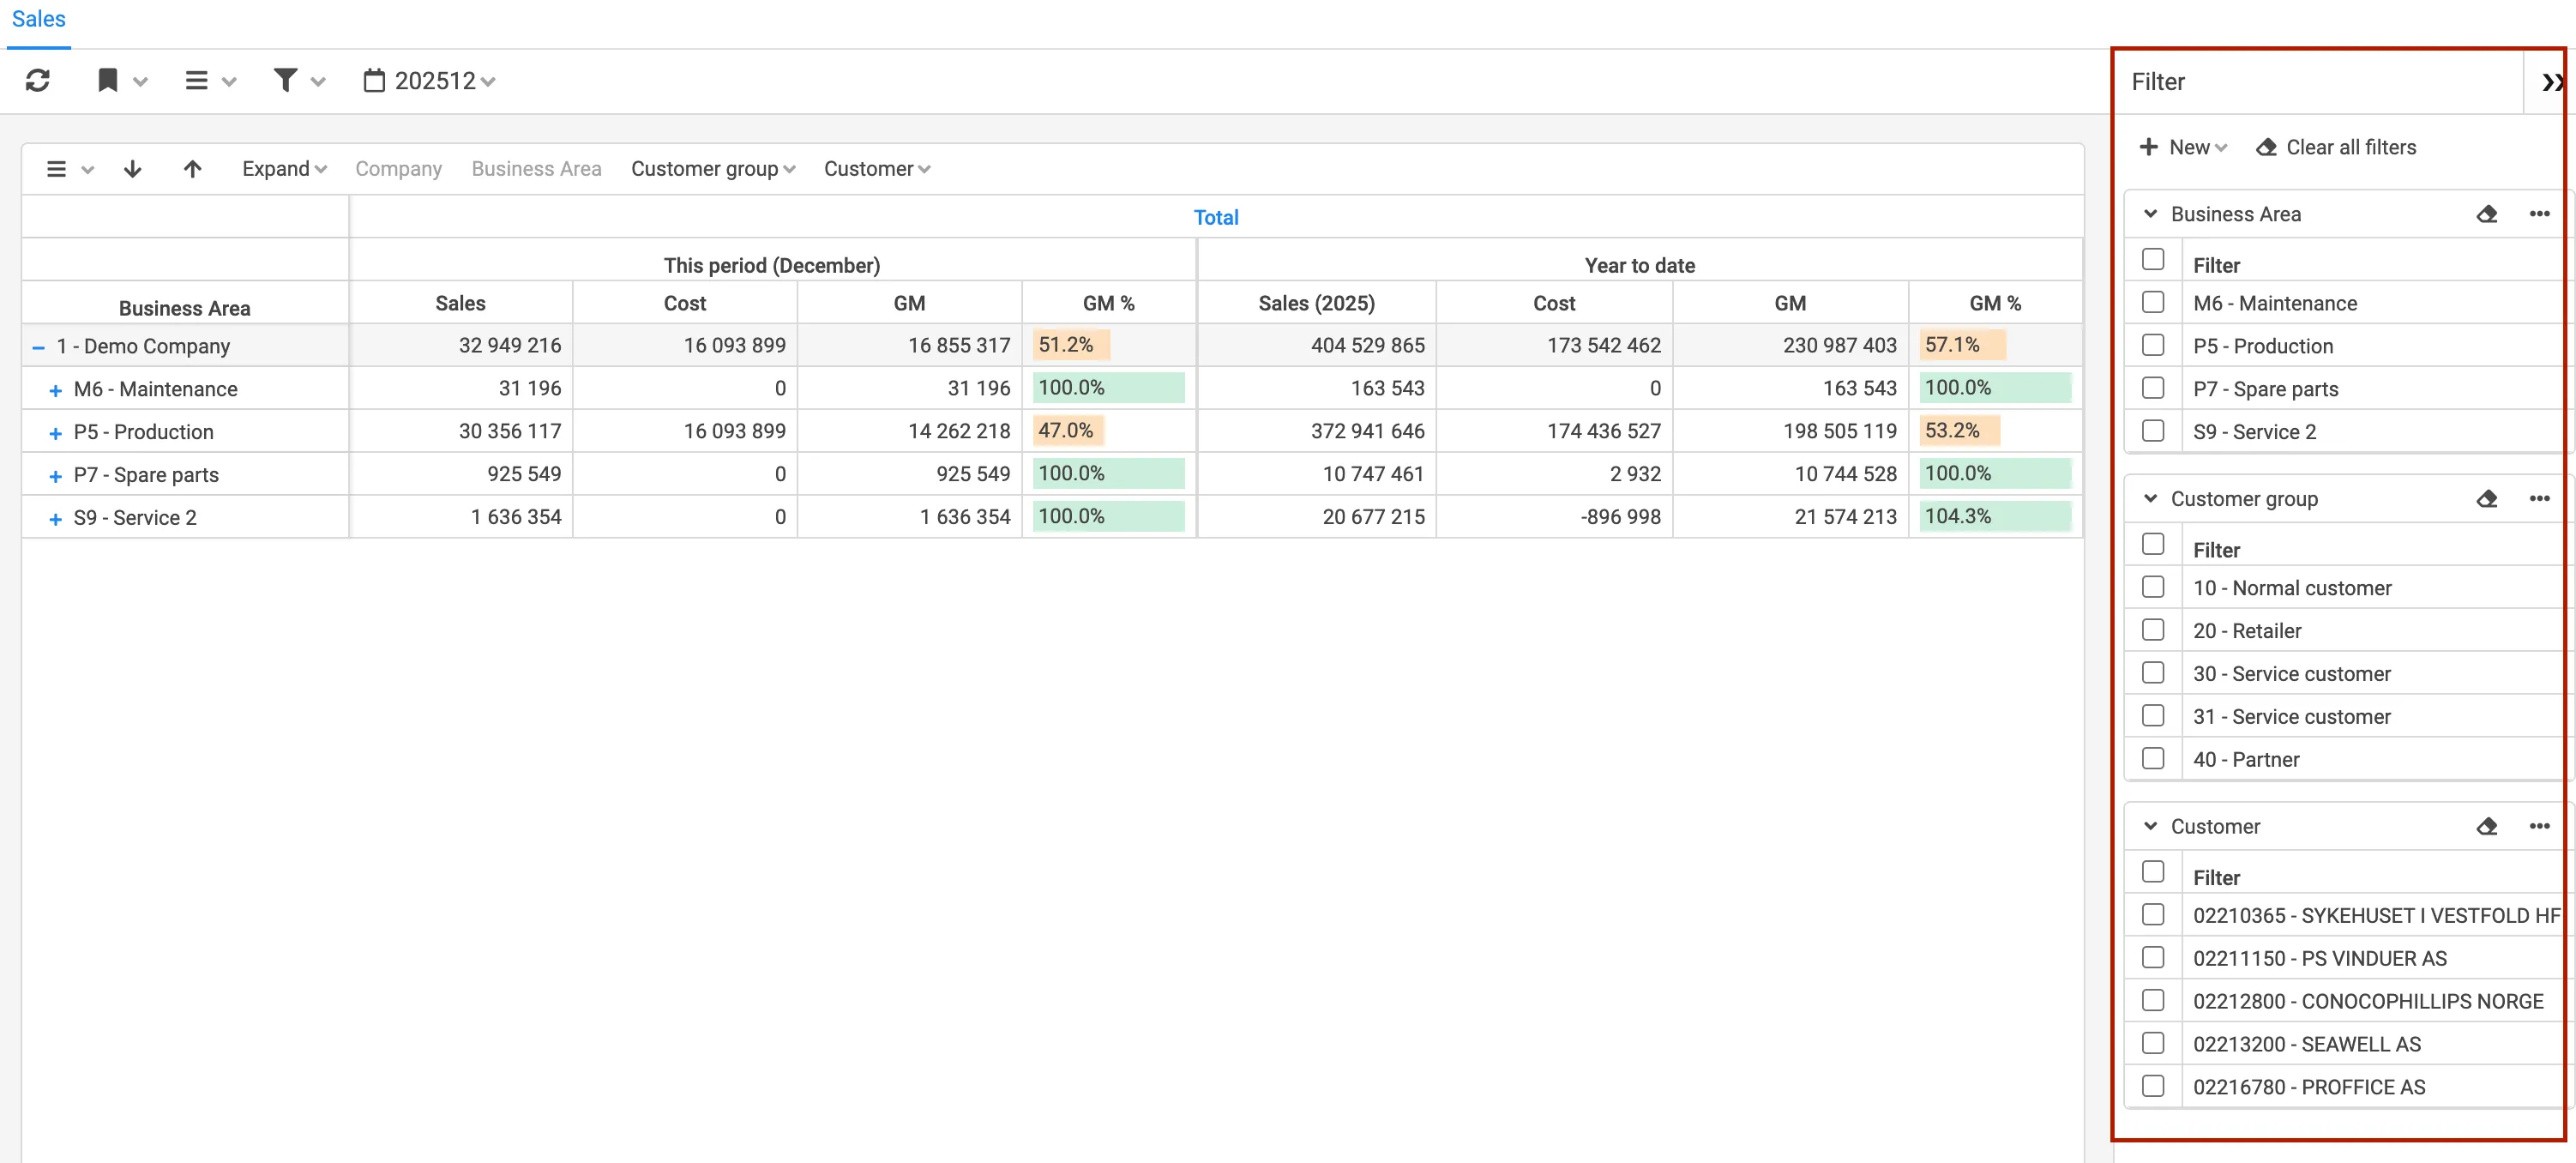
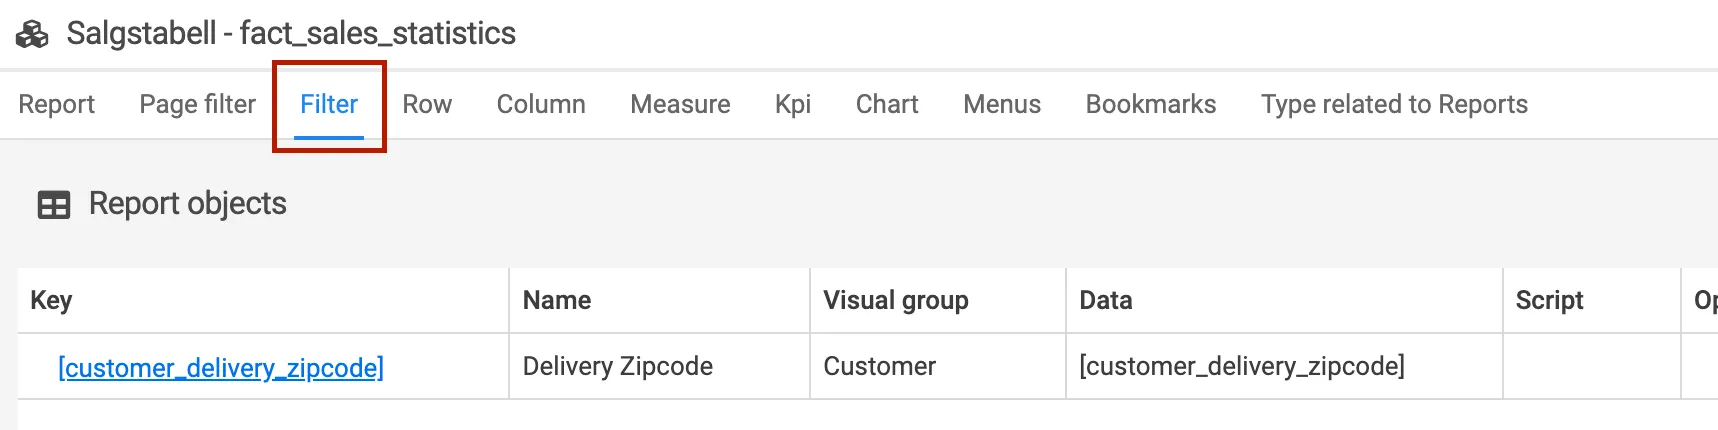
Filter
Section titled “Filter”Filters are used to control which data is included in the report. Compared to page filters, filters provide more quick access to advanced filtering options and allow you to define detailed conditions for how data should be included or excluded.
Filters are typically used when more complex filtering logic is required and the users need a quick access to filter in the report.
All dimensions that are included in the report can be used as filters.
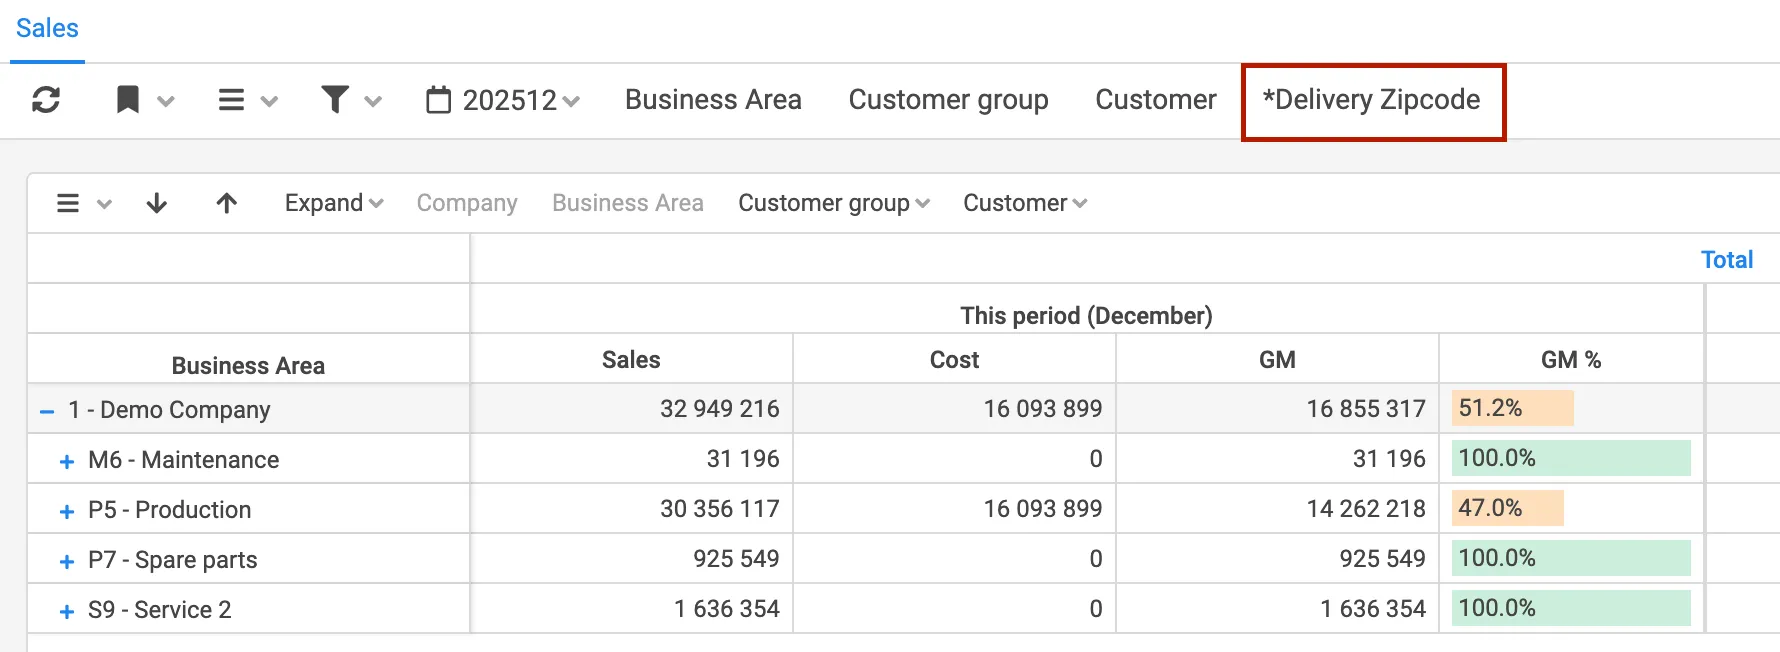
To configure filters, switch to Edit report mode and open the Filter tab. From here, you can select which dimensions should be available as filters and define how they should behave. Always set a default operator for each filter.
In reports, you can set a standard drill path.
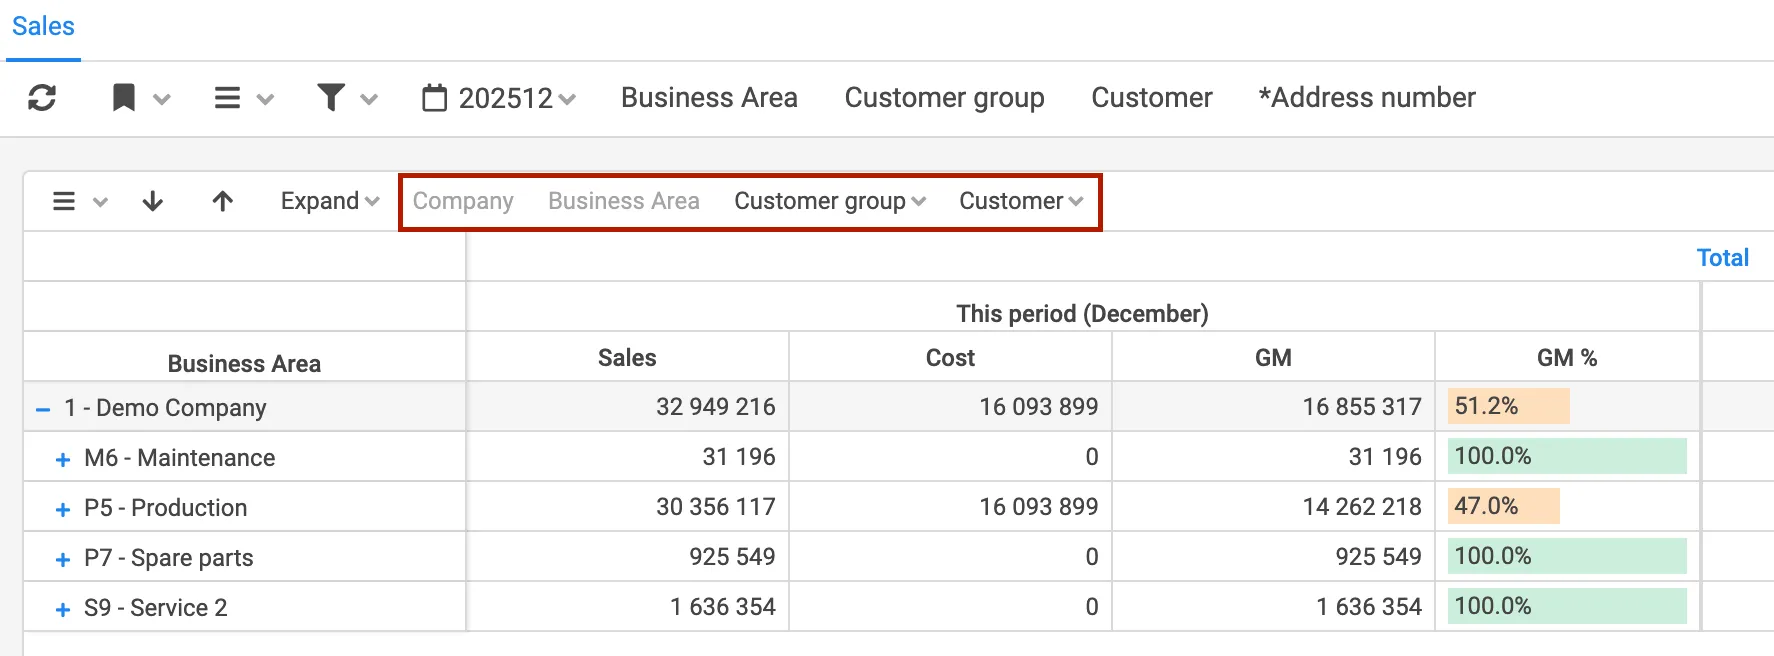
All dimensions added to the data source are available to set as rows. This can be done in the tab row when you are in edit report mode.
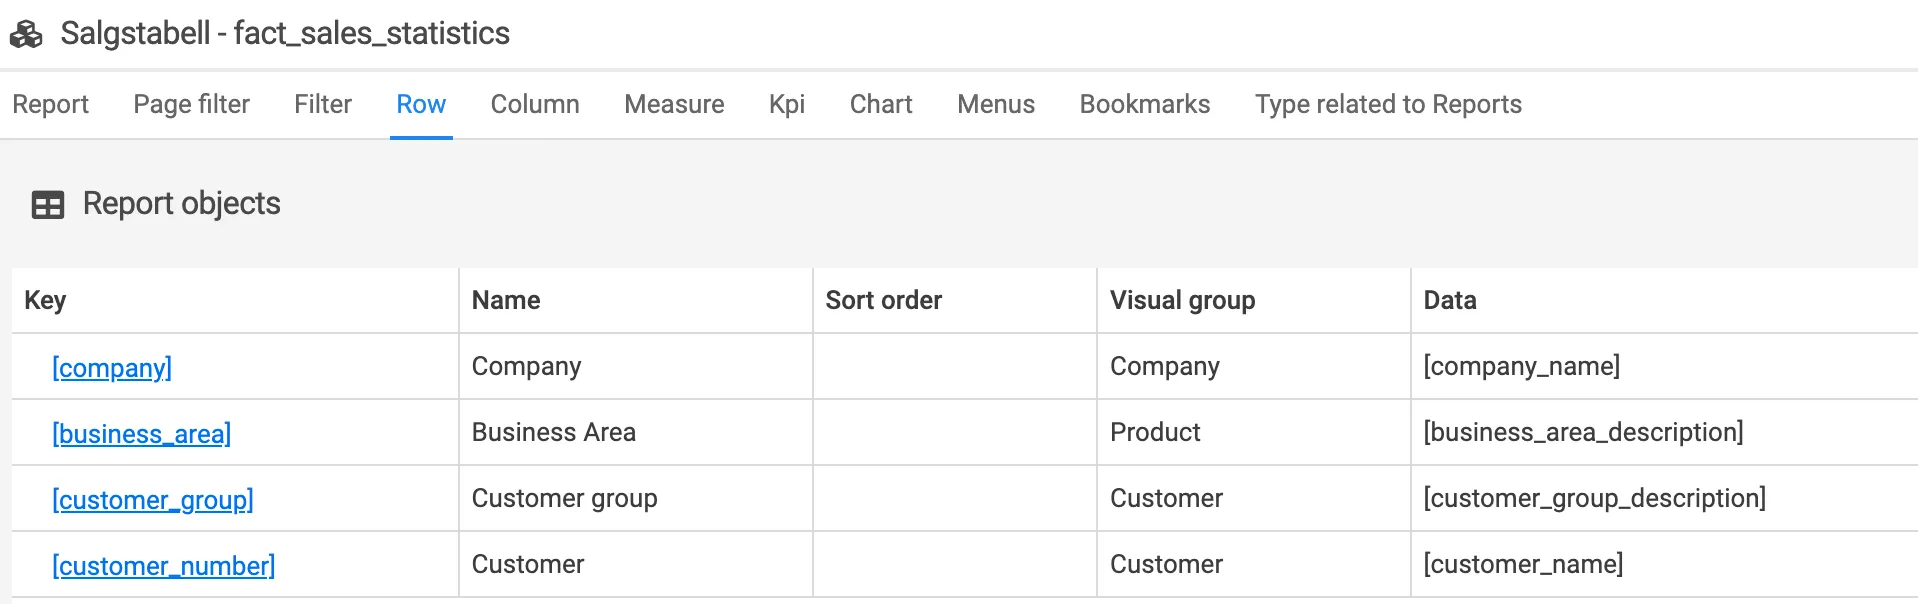
Sorting of the dimension is possible.
Column
Section titled “Column”In reports, you can set a standard drill path also on the x-direction.
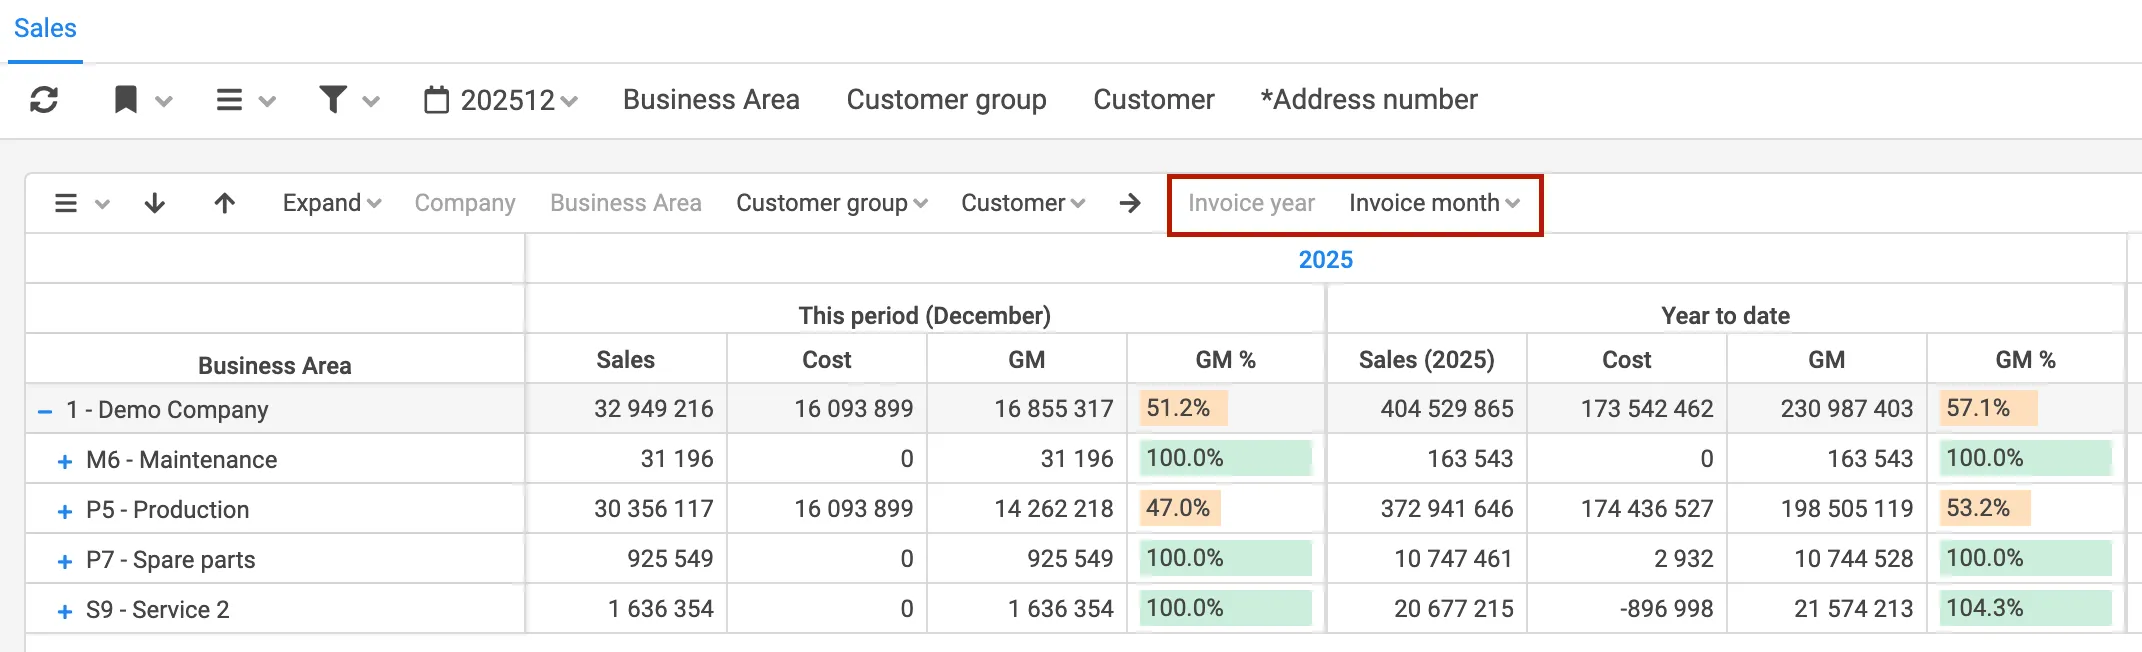
All dimensions added to the data source are available to set as columns, but company and period is often used. This can be done in the tab column when you are in edit report mode.
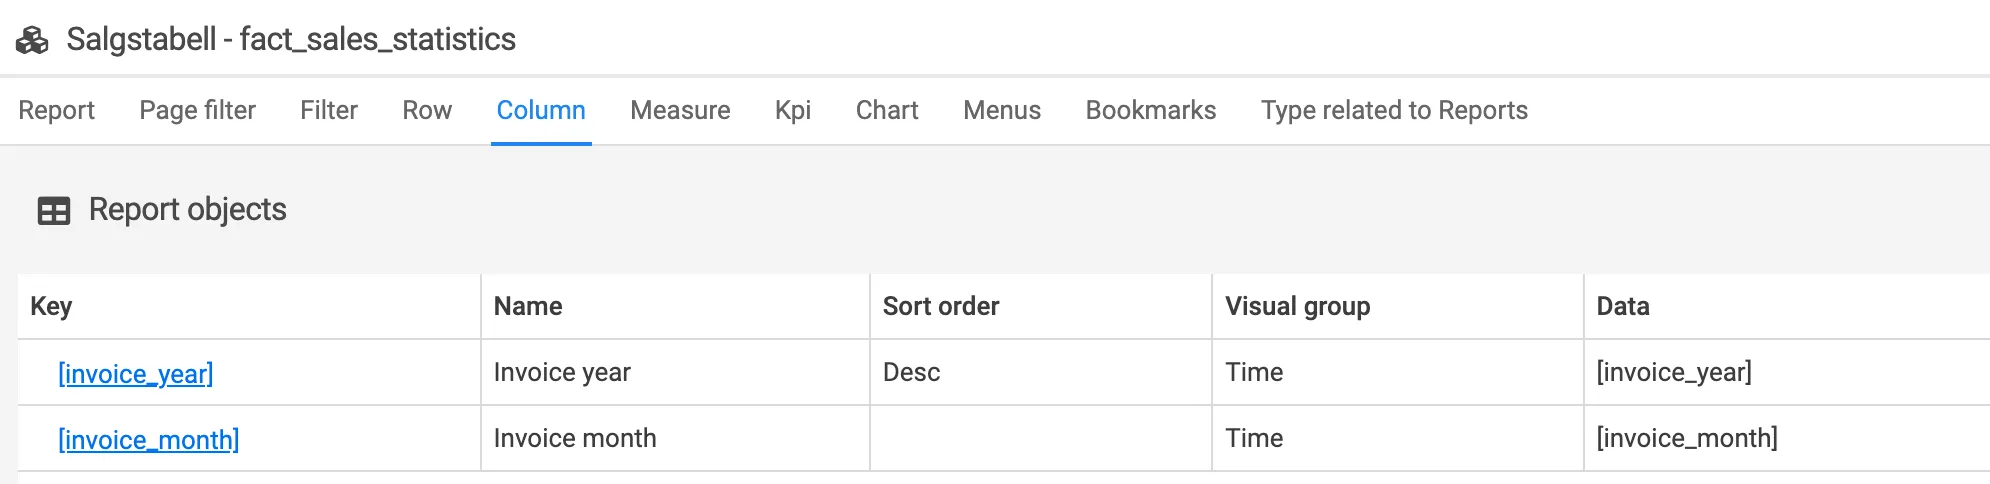
Sorting of the dimension is possible.
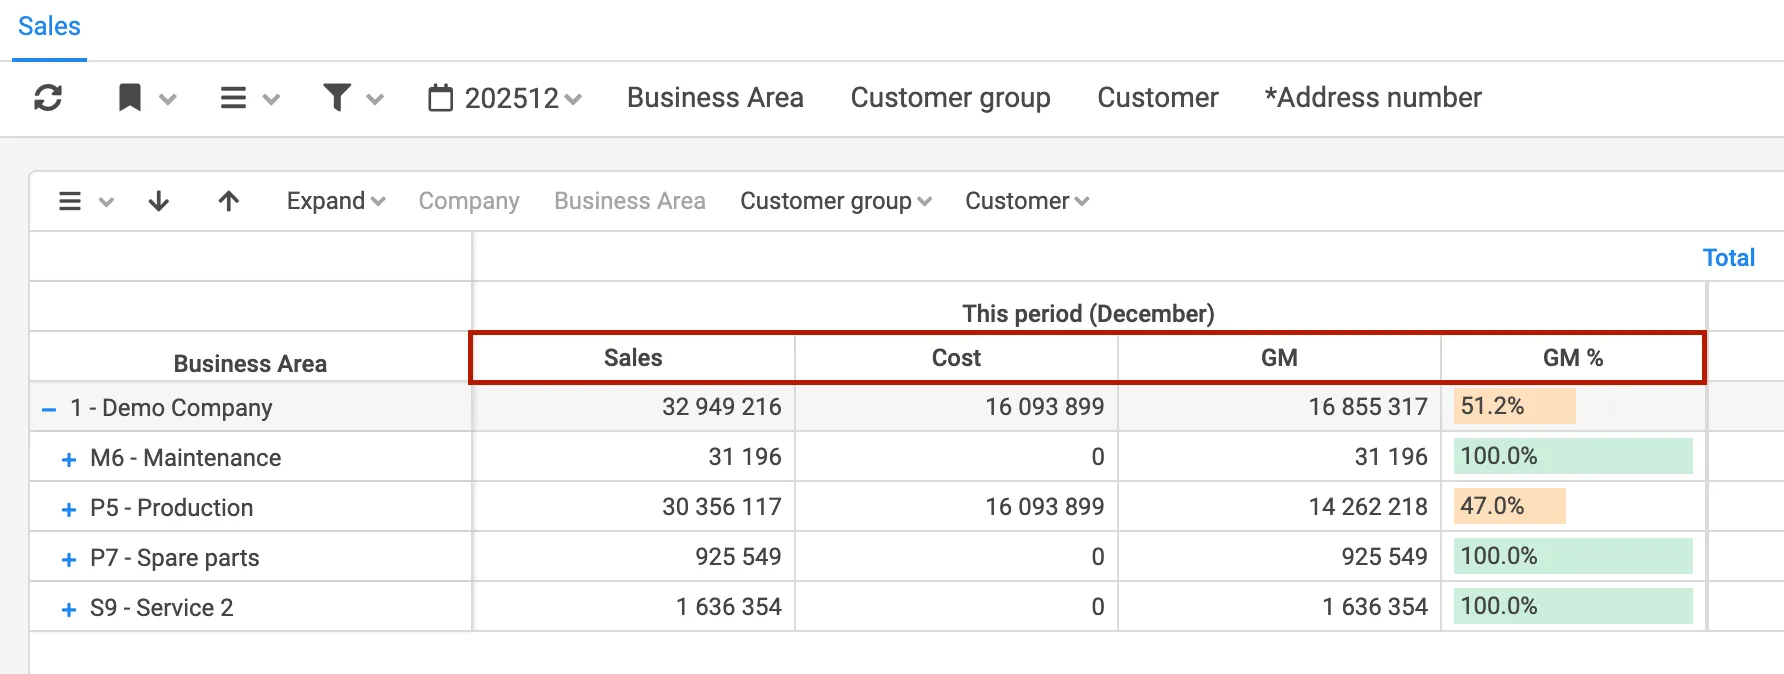
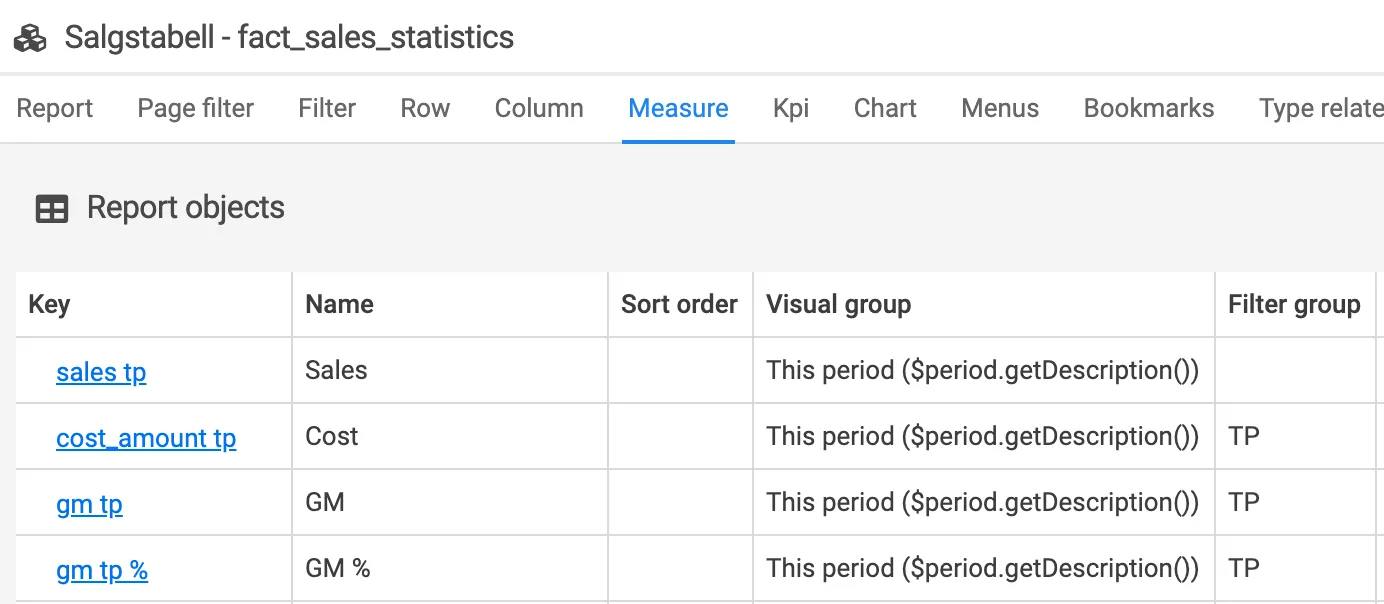
Measure
Section titled “Measure”All measures added to the data source are available to set as measures. This can be done in the tab measure when you are in edit report mode. Regarding how to create a measure in the data source, see the data source documentation.
In the menu tab the report is connected to a menu point in addition to which role(s) should have access to the report.
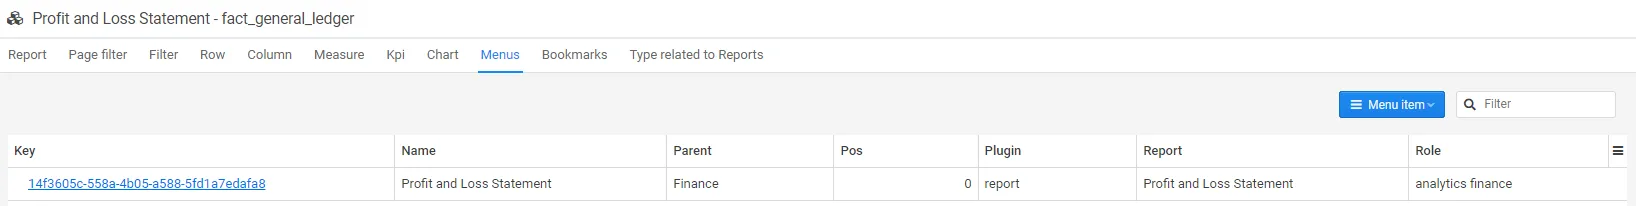
Several roles can be selected.
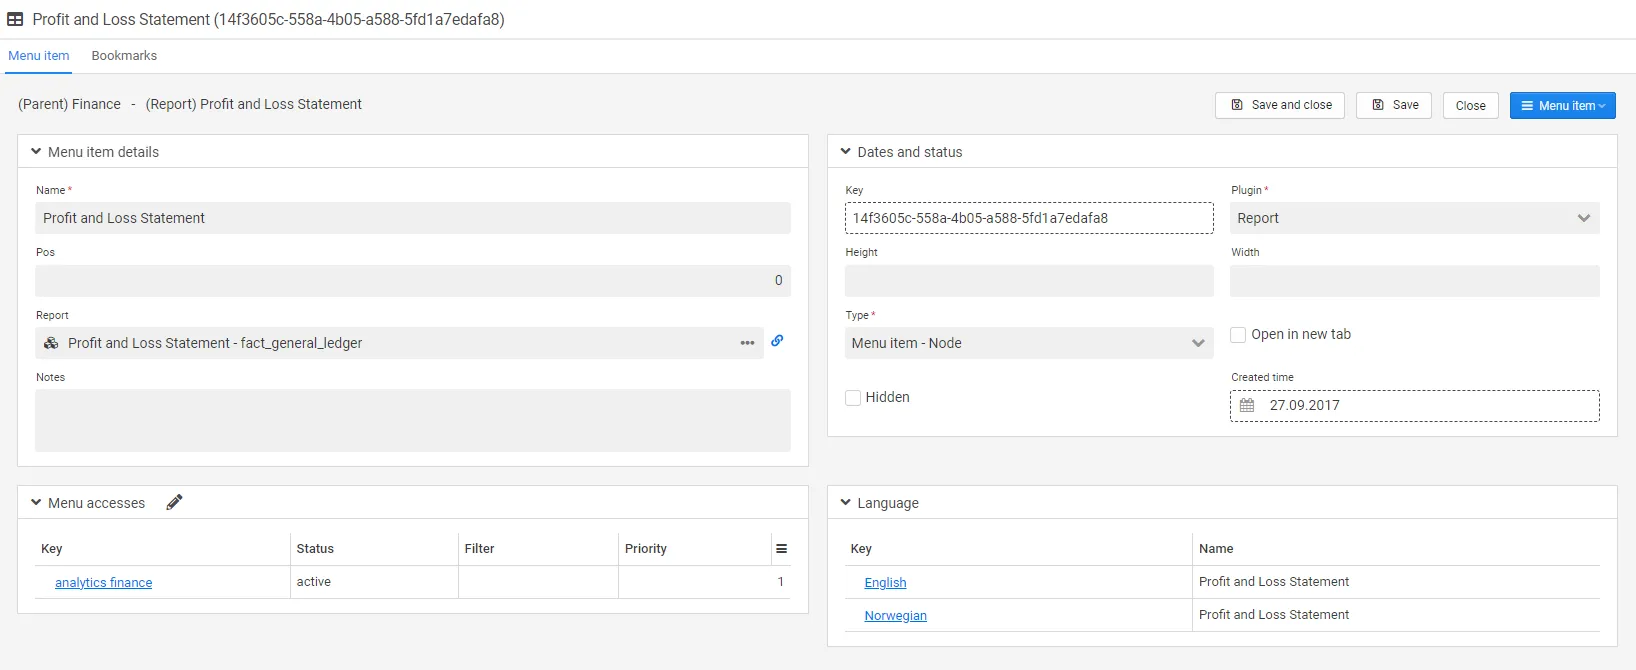
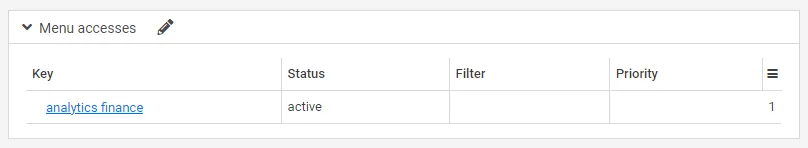
In the menu access section, you get an overview of which menu points the report is connected to. This is also where filters related to which access the various roles should have to the report is set. In the example below, the users have access to all data.
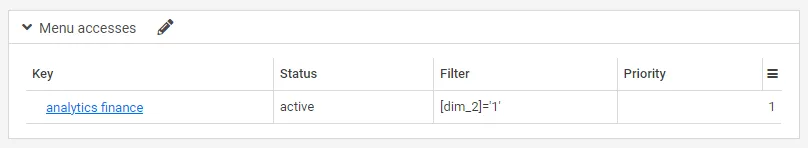
When a filter is set on the user role as below, the user will only see data specified by the filter.
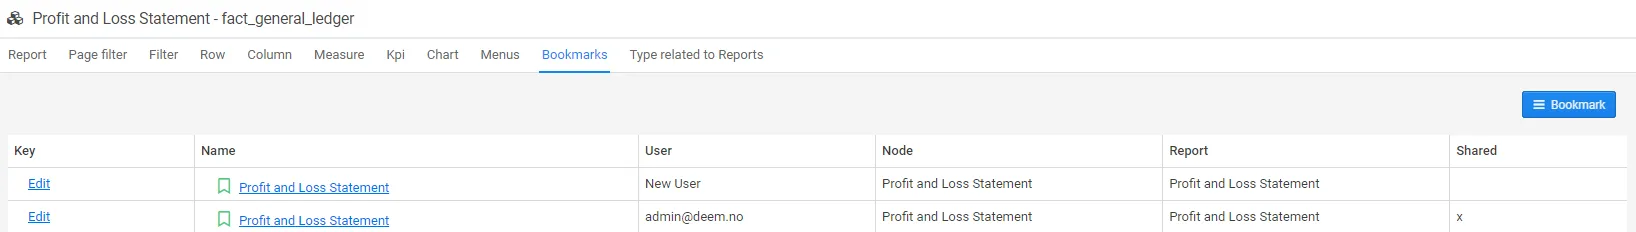
The bookmarks tab is an overview of existing bookmarks related to the report.
Bookmarks
Section titled “Bookmarks”The bookmarks tab is an overview of existing bookmarks related to the report. For more information regarding how to set up bookmarks, please see Report bookmark
Type related to report
Section titled “Type related to report”Deem Insight can be used to connect several reports from various business areas and link and filter them to the different CLM parts as e.g. account, project. The example below is related to user request.
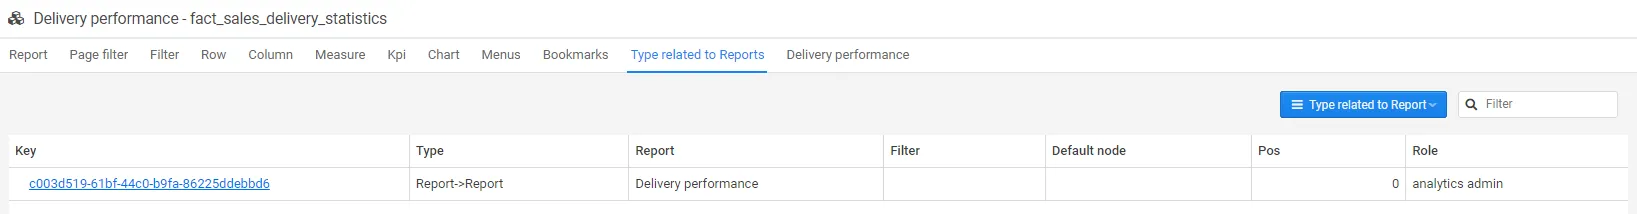
More information regarding type related to report can be found in type related to report.
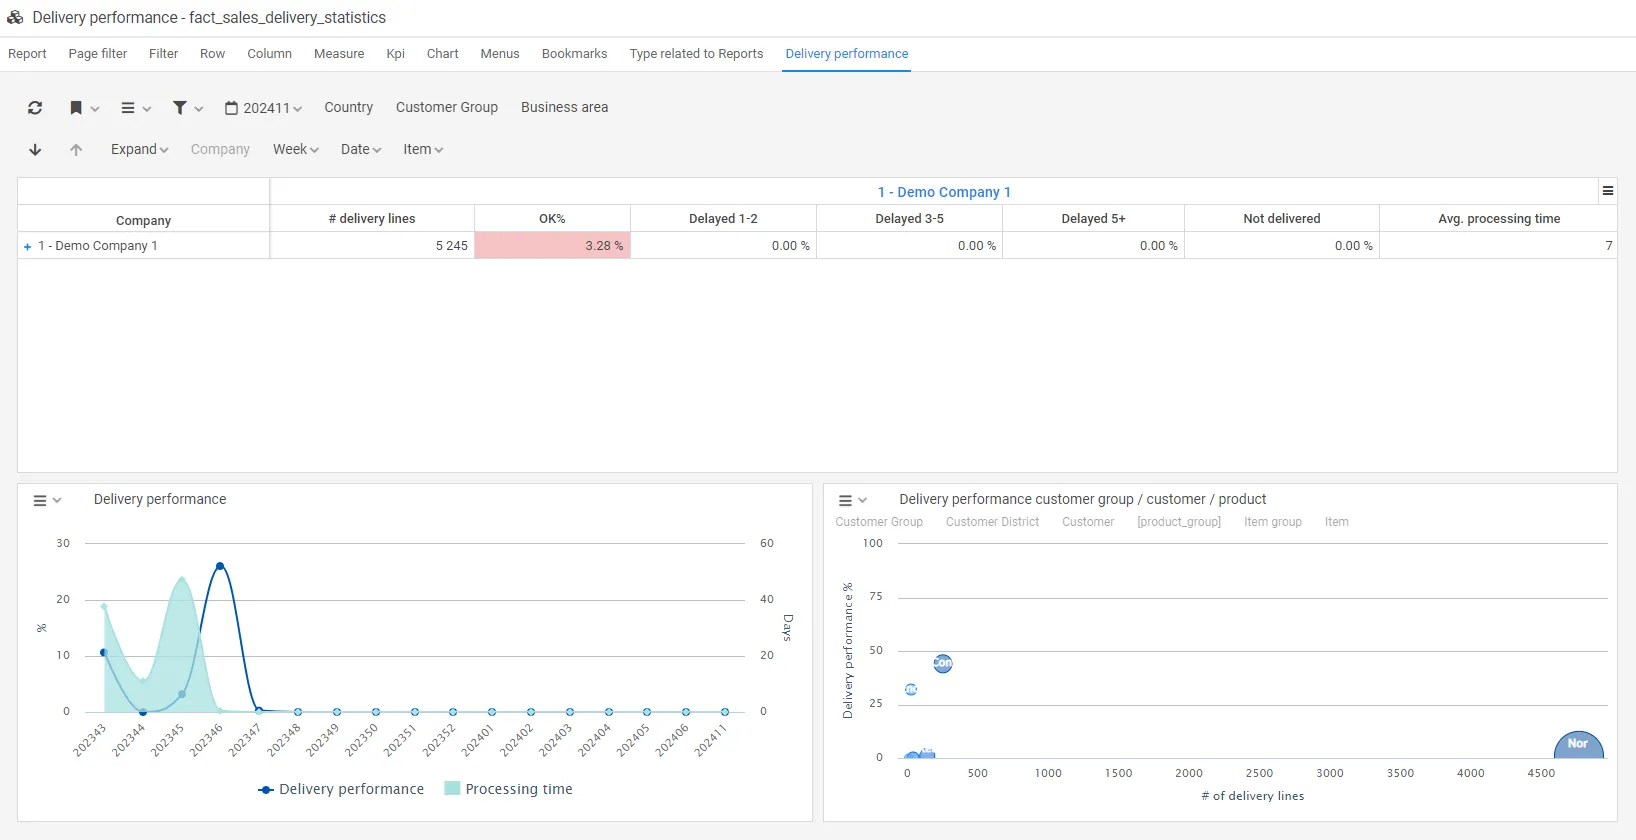
Delivery performance
Section titled “Delivery performance”In this tab the user statistics for the selected report is shown.
Filters
Section titled “Filters”Filters added to the report are not possible for the user to remove or change. Standard SQL syntax is used (see SQL where clause).
Please note that most of the period scripts can be offset by adding +/- offset, -1 returns previous value.
In addition, some parameters in the filter might be scripted. The following expressions are supported.
| Function and script | Description |
|---|---|
$period.getCP(int i) | Returns current period, possible to offset +/- with input integer, 6 digits (‘201810’) |
$period.getCP_LY() | Returns current period last year, 6 digits (‘201710’) |
$period.getCP_LYTD() | returns periods LYTD, to be used with IN operator: (‘201801’,‘201802’). |
$period.getCP_YTD() | returns periods YTD, to be used with IN operator: (‘201801’,‘201802’,‘201803’,‘201804’). |
$period.getCurrentDate() | Returns the local date (‘20181016’) |
$period.getPeriod() | Returns the current period as integer, 6 digits (week or month based on the settings in $period.setMode()) (‘201847’) |
$period.getPeriodStr() | Returns the current period as string, 2 characters (‘01’) (week or month based on the settings in $period.setMode()) |
$period.getQuarter(int i) | Returns a quarter, can be offset by adding +/- offset, -1 returns previous quarter. 6 digits (‘201803’) |
$period.getTerial(int i) | Returns a financial terial, can be offset by adding +/- offset, -1 returns previous terial. (‘201802’) |
$period.getType() | returns TYPE_MONTH(month) or TYPE_WEEK(week). |
$period.getYear(int i) | Returns this periods year, can be offset by adding +/- offset, -1 returns previous year. (‘2018’) |
Prerequisites
Section titled “Prerequisites”- A verified connection and data source.
- Analytics administration access for the user.
Applies to
Section titled “Applies to”- Product: Deem Insight
- Area: Report administration
- Role: Administrator, consultant
Why does a new report show empty data?
Section titled “Why does a new report show empty data?”Check data source mapping, default filters, and role/menu access on the report.
Should I use page filters or regular filters first?
Section titled “Should I use page filters or regular filters first?”Use page filters for common user controls and regular filters for stricter report-level constraints.