Report functionality
Within your menu, you will be given access to a number of reports. Based on the setup done by your administrator, the naming of the reports will be specific to your company. This guide will give an overview of general functionality within a report.
Multidimensional report overview
Section titled “Multidimensional report overview”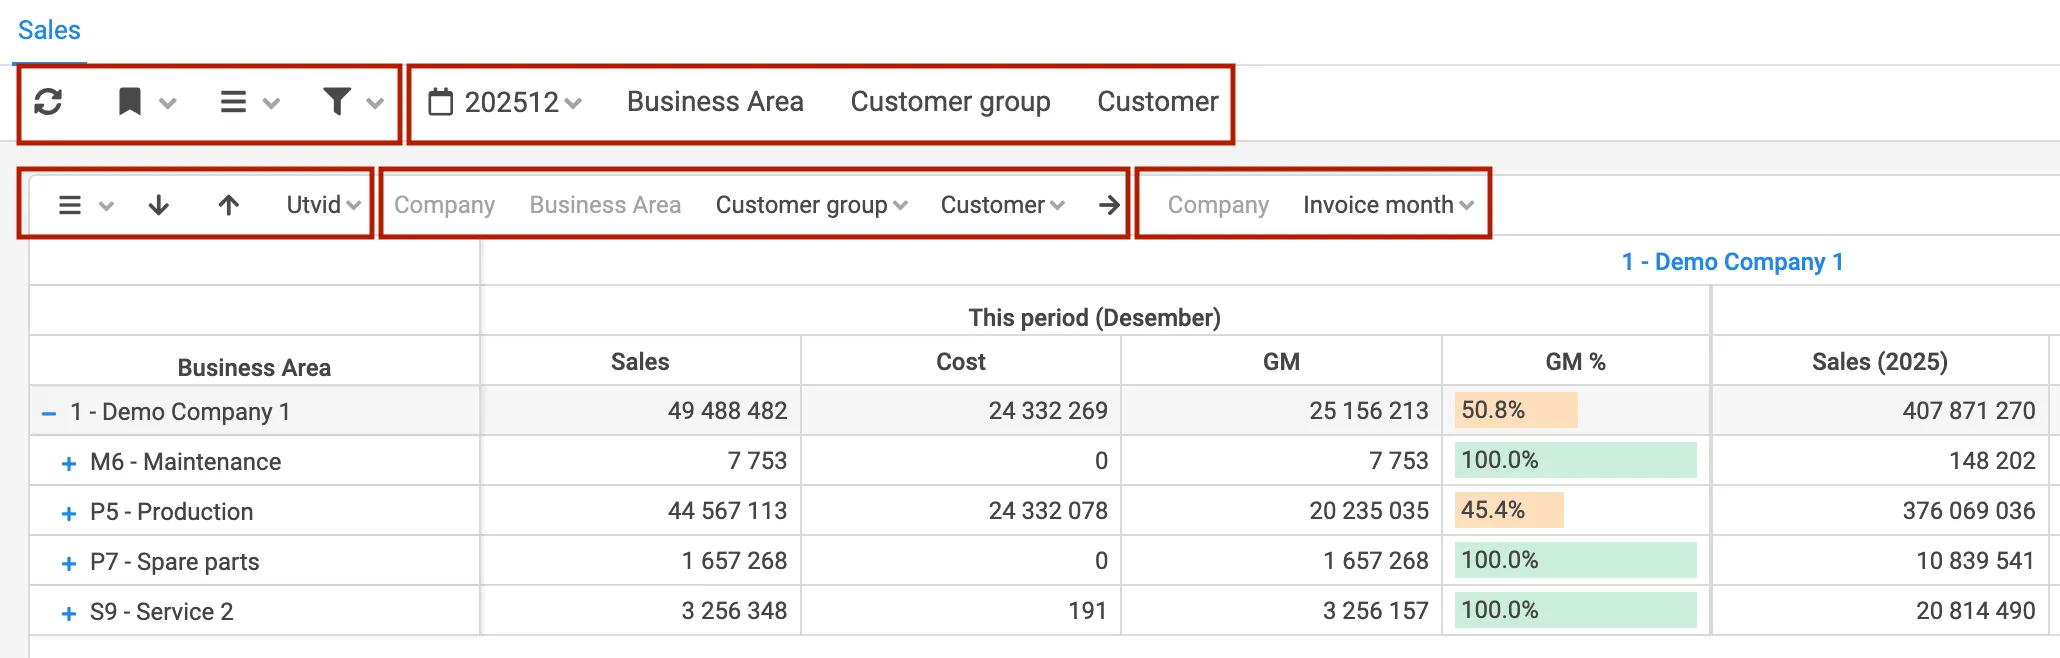
- The top toolbar contains refresh, bookmark, filter, and report menu actions.
- The center table is the primary drill area for Y and X dimensions.
- Active filters are listed in the selected filters section.
| Function | Description |
|---|---|
| Refresh | Reload the report, removes all user filters/changes |
Bookmark 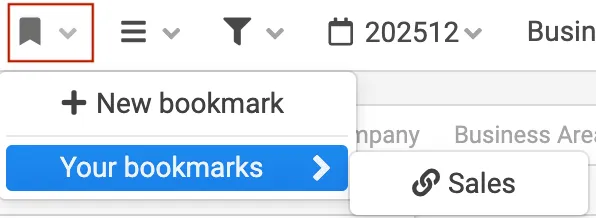 |
|
Menu 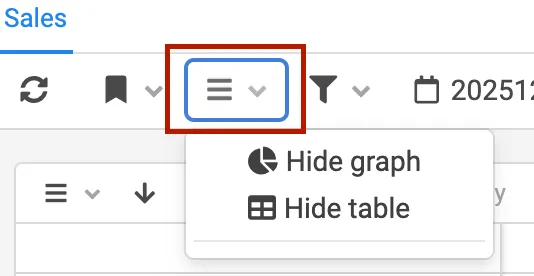 |
|
Filter 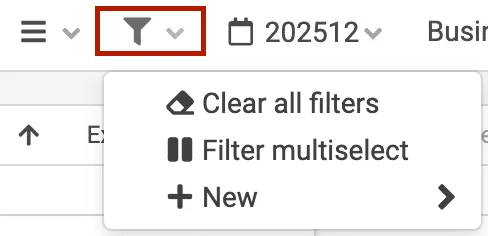 |
|
| Selected Filters | Filters predefined by the administrators and added by you will appear in this section of the report |
Report menu 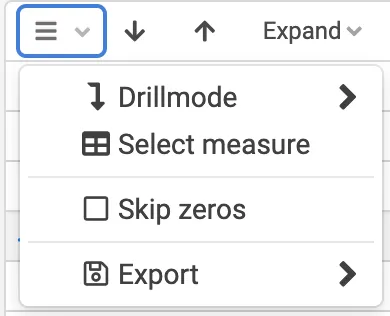 |
|
| Expand | This arrow will expand the report in the “Y” direction, with the next level |
Expand 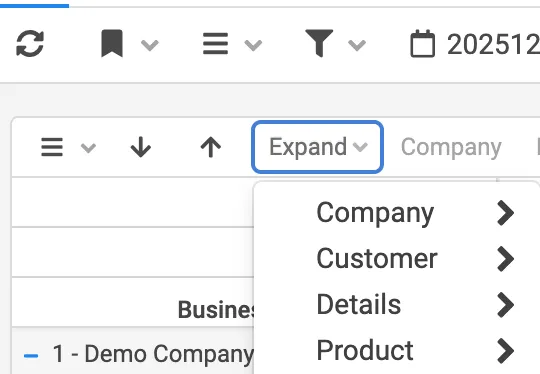 | This menu will add the dimension you select to the next level. |
| Y-Dimension | The dimensions selected to be the traditional drill path for the report in the Y direction |
| X-Dimension | The dimensions selected to be the traditional drill path for the report in the X direction |
Navigating the report
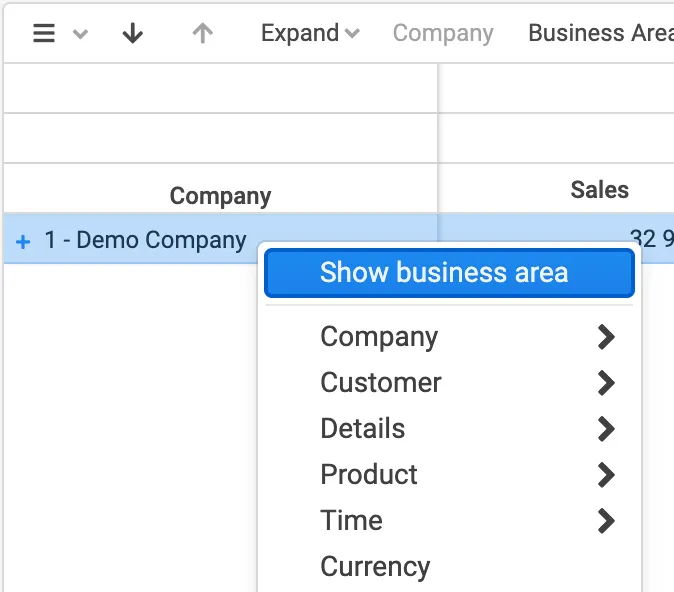
Section titled “Navigating the report”If you want to show the next level just for one row you can click the [blue]#+#, or the text. It is also possible to select any other dimension by opening the drill menu. This menu is opened by “right click”
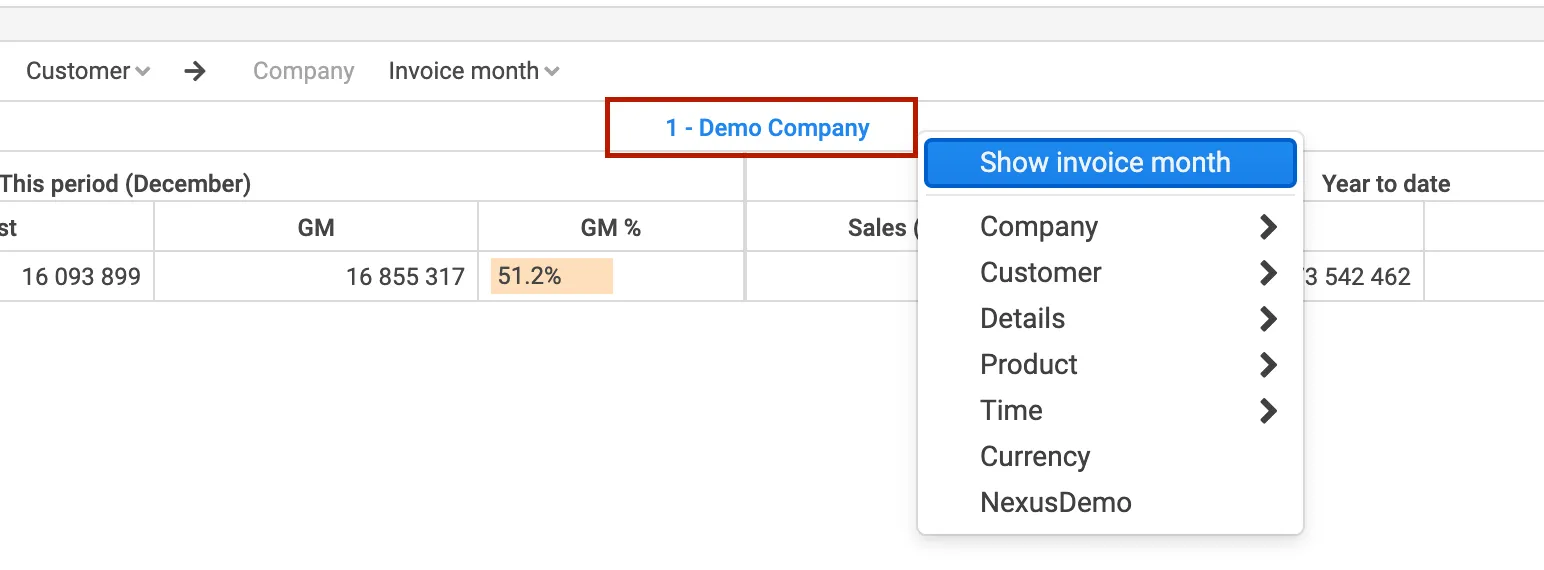
It is also possible to drill/open dimensions on the X-axis, this is done by right-click” on the title line (outside the text):
The report can be collapsed by using the ”-” sign on the dimensions.
Linked content
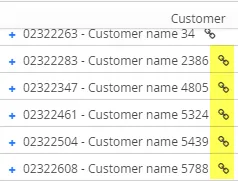
Section titled “Linked content”The dimensions can be linked to records in Deem Insight, or to other reports. If this is the case, a symbol will appear on the record:
Sorting
Section titled “Sorting”![]()
By default, with no ((sorting)) on measures, the report is sorted by the selected dimension. By clicking a measure header, it will be sorted descending, click once more for ascending, and once again to remove the sorting.
Graph functionality
Section titled “Graph functionality”Graphs are used to visualize values and to filter content. On mouse over, the actual values are shown:
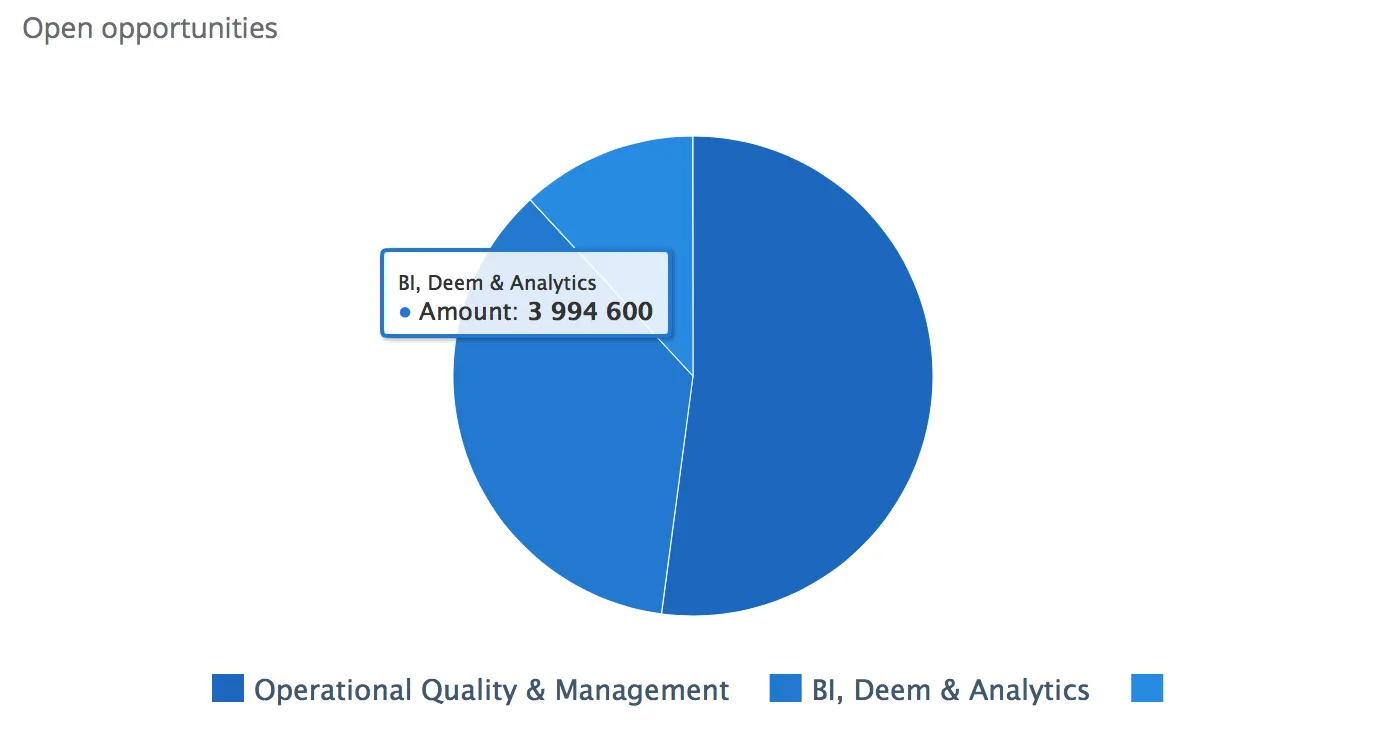
When clicking this section of a graph, the entire report is filtered using this dimension. The filter used will be shown both in the graph itself, and also added to the report filters.
Export
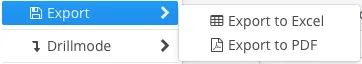
Section titled “Export”![]()
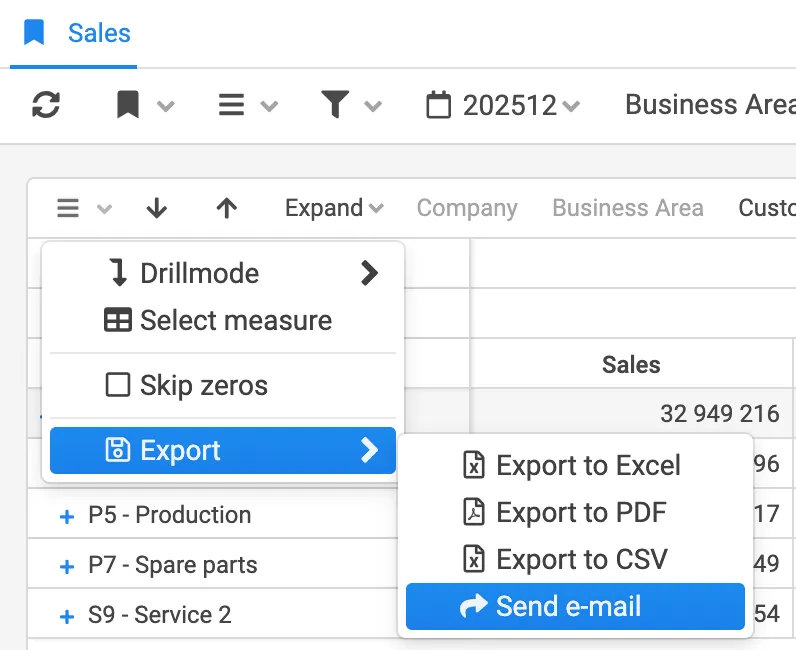
The export functionality covers Excel and PDF download of the report, and it will contain data currently showing in the report area.
The export dialog gives you as a user some possibilities to format the output
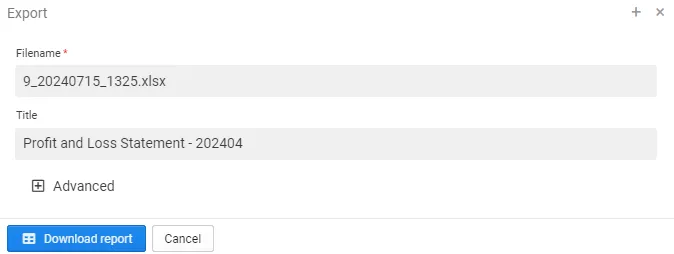
- Name: The file name
- Title: The report title in the document
Using the “Advanced options” you can also change the following options:
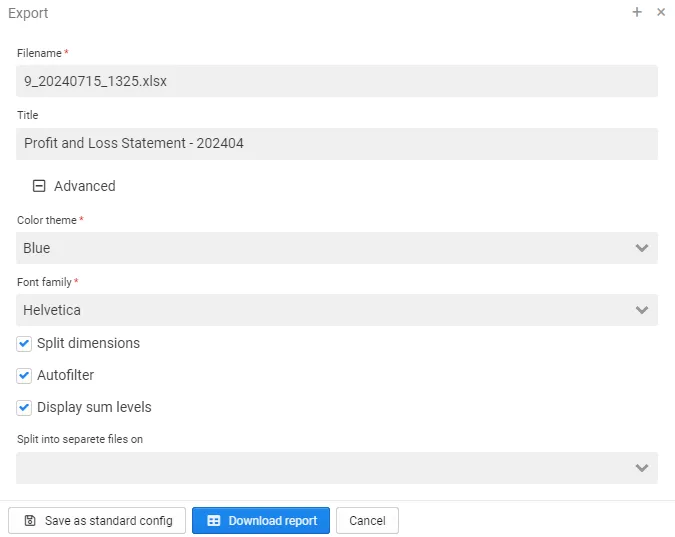
- Color Theme: The colors within the report
- Font: Options to use fonts that are mono-spaced (Courier)
- Split Dimensions: Dimensions where e.g. id and name is combined are split into two columns
- Autofilter
- Sum levels in export
- Split export in detail files on
Drillmode
Section titled “Drillmode”![]()
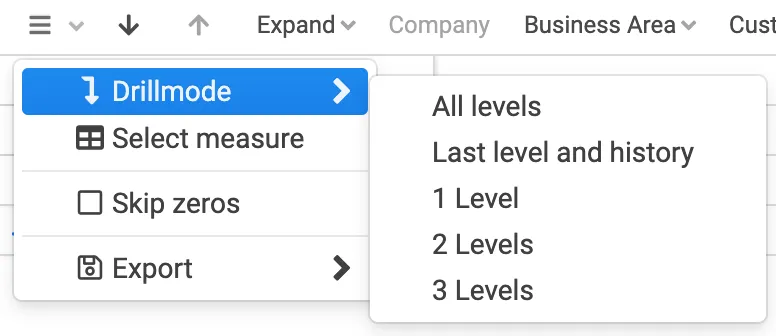
Drill Mode controls how dimensions are expanded vertically in the report. It allows you to expand multiple levels in a single action.
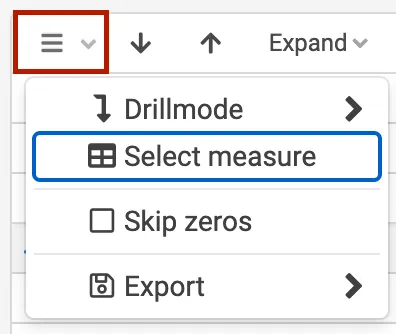
To access Drill Mode, open the table menu and select Drill Mode. You can choose between:
- All levels
- Last level and history
- 1, 2, or 3 levels
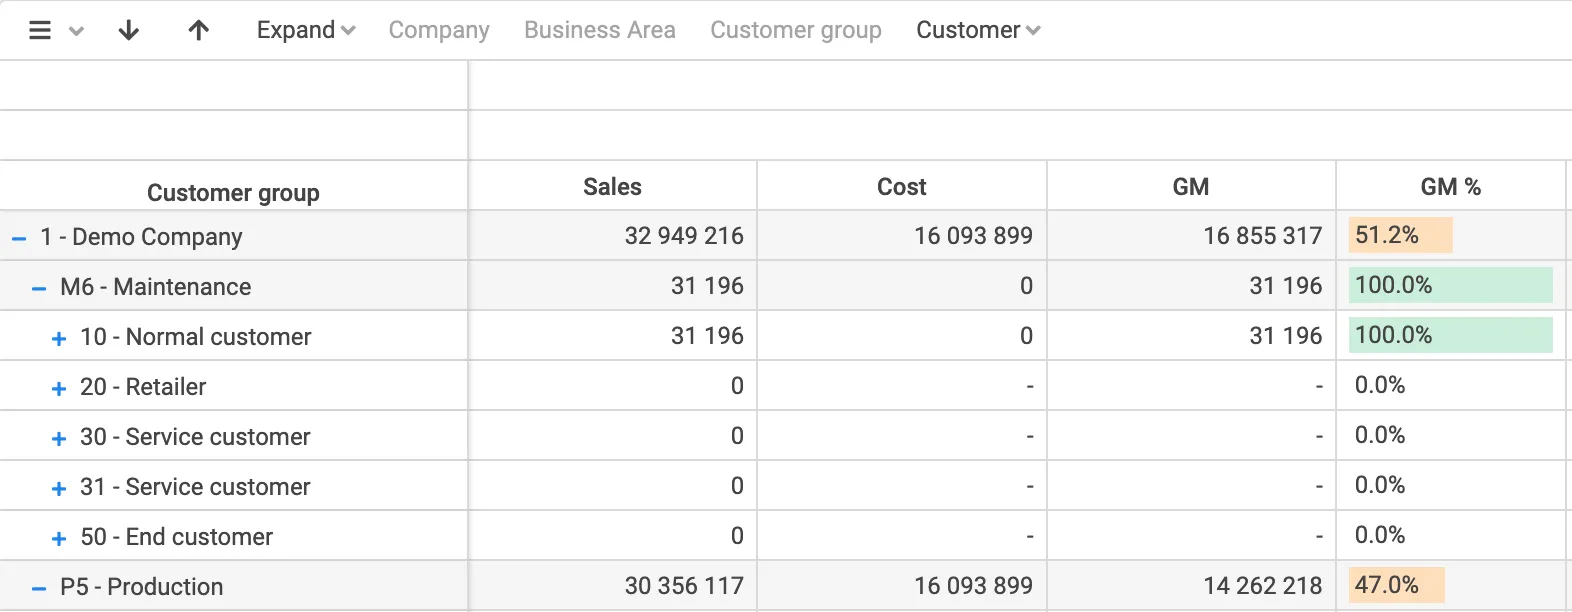
All levels
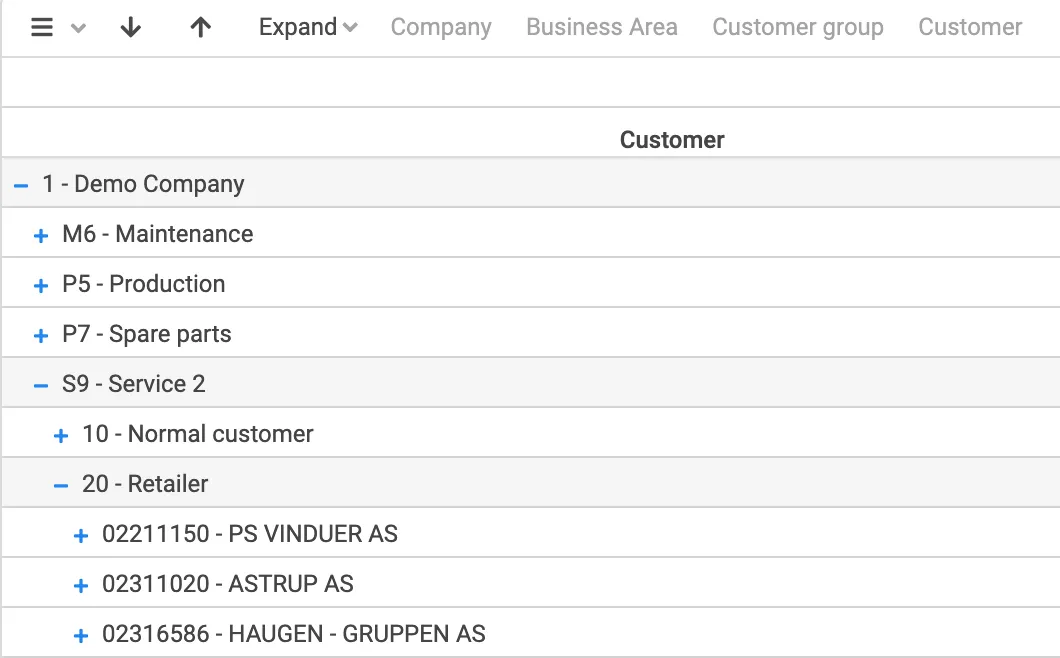
Section titled “All levels”Expands all available levels in the selected dimension when drilling.
All existing dimension values remain visible, allowing you to see the full structure while drilling deeper. No data is collapsed when a new drill is applied.
Last level and history
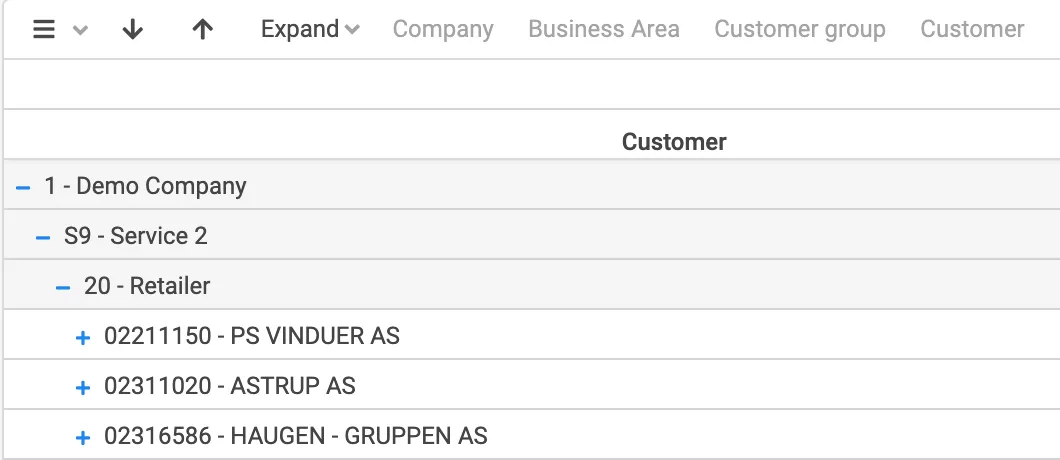
Section titled “Last level and history”Focuses only on the active drill path. This is the default drill behavior.
When drilling, all other dimensions are collapsed and only the selected element and its parent hierarchy remain visible. This helps reduce noise and keeps the report focused on the selected drill structure.
3 levels, 2 levels and 1 level
Section titled “3 levels, 2 levels and 1 level”These options control how many levels in the drill path are expanded.
- 3 levels
Opens three levels in the drill path. In this case, it produces the same result as All levels, showing all three available levels.
- 2 levels
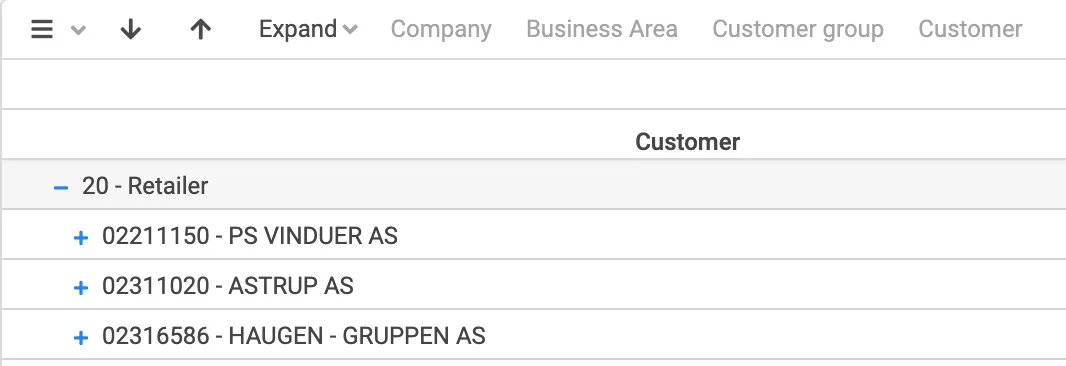
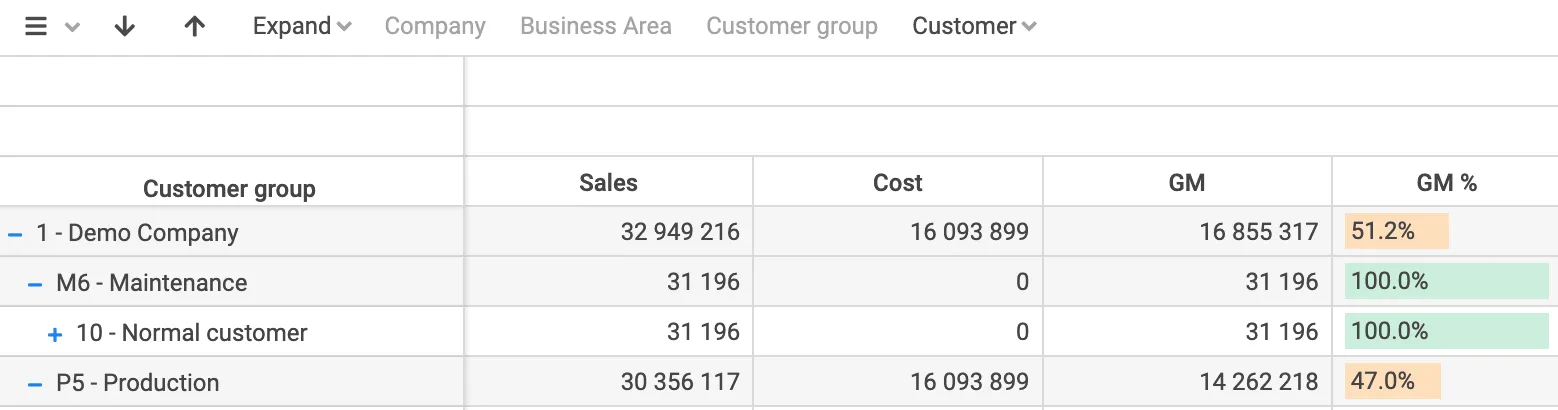
Skips the top level and hides the Company dimension, showing only two levels in the report.
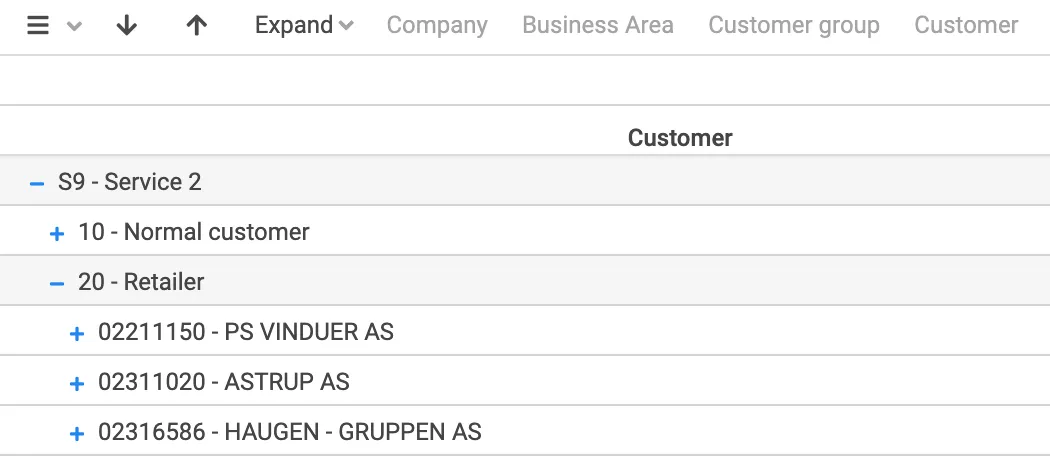
- 1 level
Skips the two top levels and hides both the Company and Business Area dimensions, showing only the lowest level.
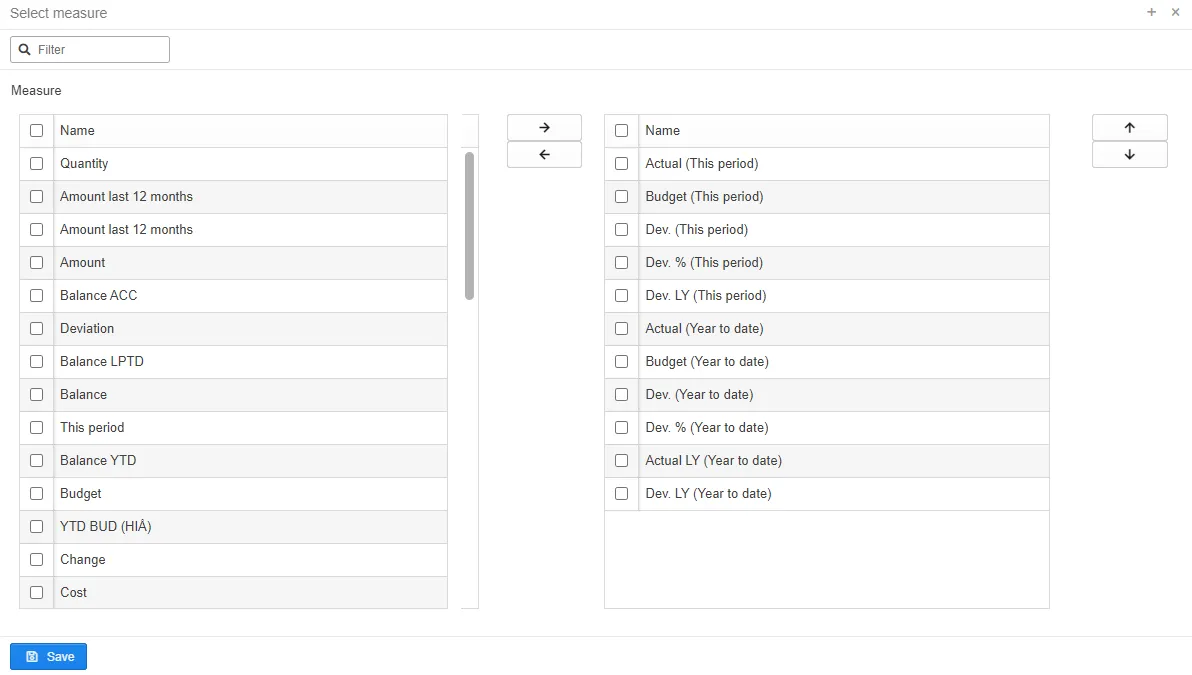
Select measure
Section titled “Select measure”It is possible to hide or add measures in a report, this is done by selecting “Select measure” in the table menu. Please note that this will not change the original settings for the report. These changes apply only for your session. You can of course save it as a bookmark for later use.
Show or hide graph or table
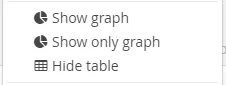
Section titled “Show or hide graph or table”You can show or hide both graphs or tables in the reports by selecting show or hide graphs or table in the top menu.
Report bookmark
Section titled “Report bookmark”Report bookmarks allow you to save the current state of a report, including selected filters, drill level, sorting, and view settings. Bookmarks make it easy to return to a specific report configuration or share the same view with other users.
Bookmarks can be used as shortcuts within Deem Insight and help ensure consistent report views across users and sessions.
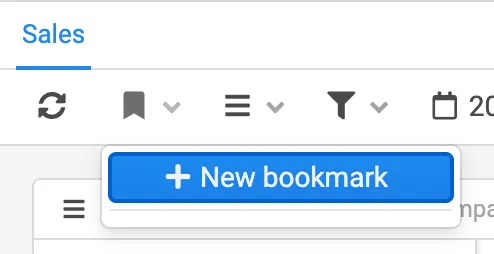
To create a new bookmark, open the bookmark menu and select New bookmark.
When creating a bookmark, you will be prompted to enter a name.
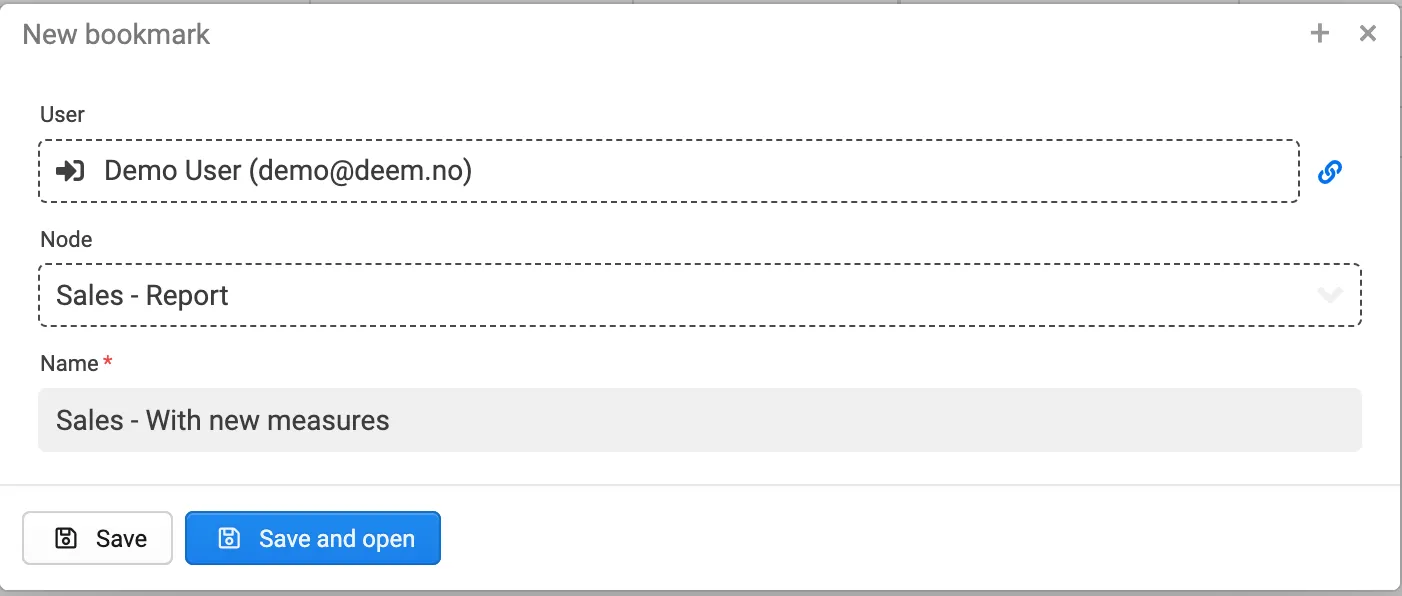
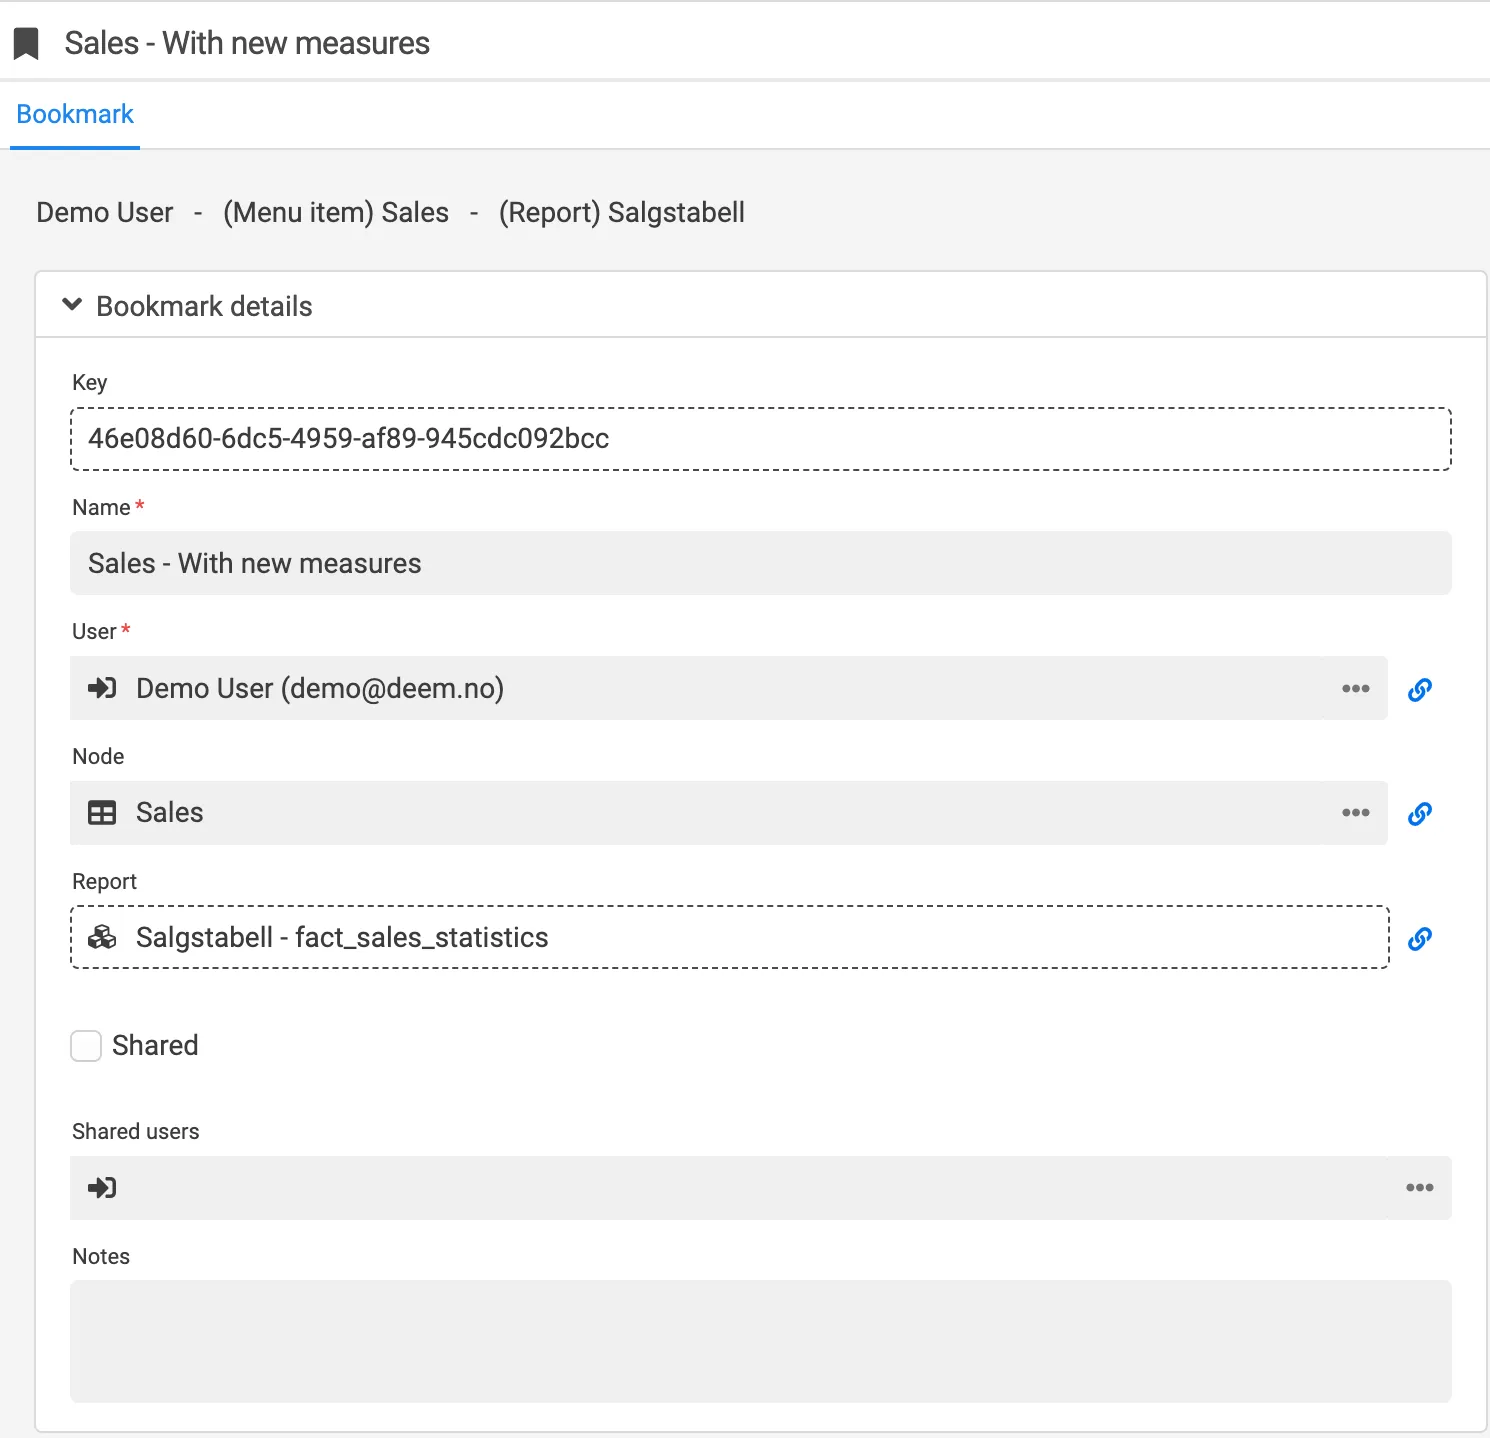
After naming the bookmark, you can review the bookmark details. From here, it is possible to adjust settings and define whether the bookmark should be shared with other users. Select Save and close to store the bookmark and return to the report in the bookmarked state.
New bookmark
- Saves the current report state. You can create multiple bookmarks for the same report to support different use cases or perspectives.
Clear bookmark
- Removes the active bookmark and resets the report to its original state, without any saved filters or drill selections applied.
Update bookmark
- Updates the selected bookmark with the current report configuration. This is useful if the report setup has changed and you want to keep the same bookmark name.
Your bookmarks
- Displays all bookmarks you have created. These bookmarks are stored for later use and can be selected at any time.
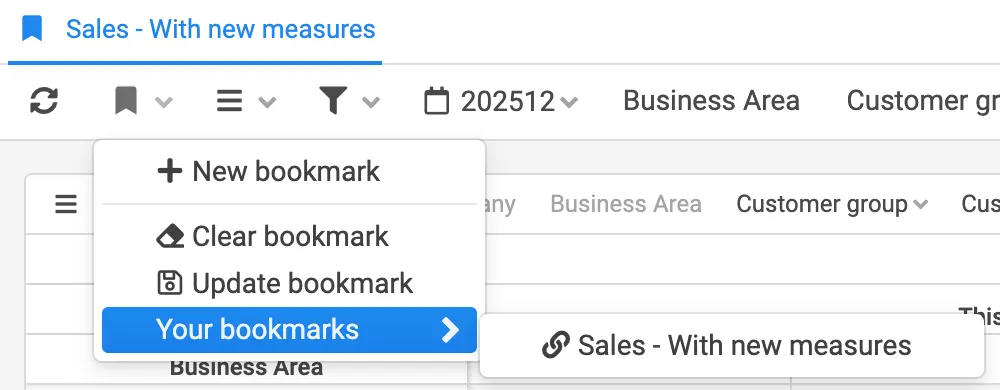
Your bookmarks are possible to reach from your home page.

Deem Insight allows you to send bookmarks by email, or send a URL link to the bookmark.
If email functionality is enabled in your Deem Insight setup, you can send the bookmark directly by selecting Send. Alternatively, you can open the bookmark in the browser and copy the URL to share it manually.
Bookmarks can also be shared internally within Deem Insight. Shared bookmarks appear in the report bookmark menu under Shared.
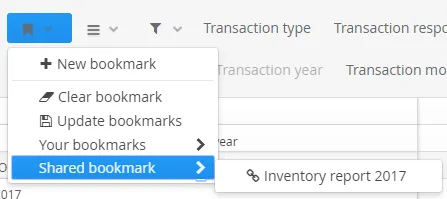
The ability to share bookmarks is controlled by role permissions. Contact your superuser if you require access to sharing functionality.
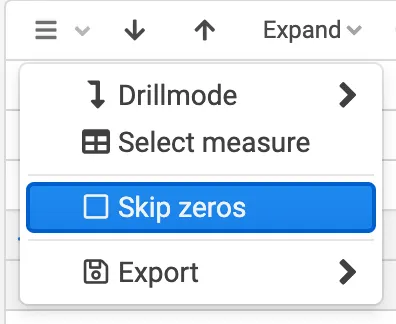
Skip zeros
Section titled “Skip zeros”The Skip zeros option allows you to hide rows in the report that contain blank values or only zero values. This can make reports easier to read by removing rows that do not contribute meaningful information.
From the table menu, you can enable Skip zeros.
When Skip zeros is enabled, rows with empty values or zero values are hidden from the report.
To show these rows again, disable Skip zeros from the same menu.
Prerequisites
Section titled “Prerequisites”- Access to at least one configured multidimensional report.
- Report permissions and menu access are assigned by administrator.
Applies to
Section titled “Applies to”- Product: Deem Insight
- Area: End-user analytics
- Role: End user, consultant
Why did my report reset after browser refresh?
Section titled “Why did my report reset after browser refresh?”Browser refresh returns to base report state unless your changes were saved as a bookmark.
Why can I not see the same bookmark options as other users?
Section titled “Why can I not see the same bookmark options as other users?”Bookmark sharing and visibility are controlled by role permissions.