Street Map
Overview
Section titled “Overview”- Type: Geographic map visualization
- Dimensions: Latitude/longitude or UTM coordinates (X/Y), measure (marker size/color)
- Use cases: Display location-based data, show geographic distribution, visualize customer locations, map sales territories
- Special features: Supports both latitude/longitude and UTM coordinate systems, interactive zoom and pan, marker-based visualization
- Visual: Interactive map with markers positioned by coordinates, sized/colored by measure values
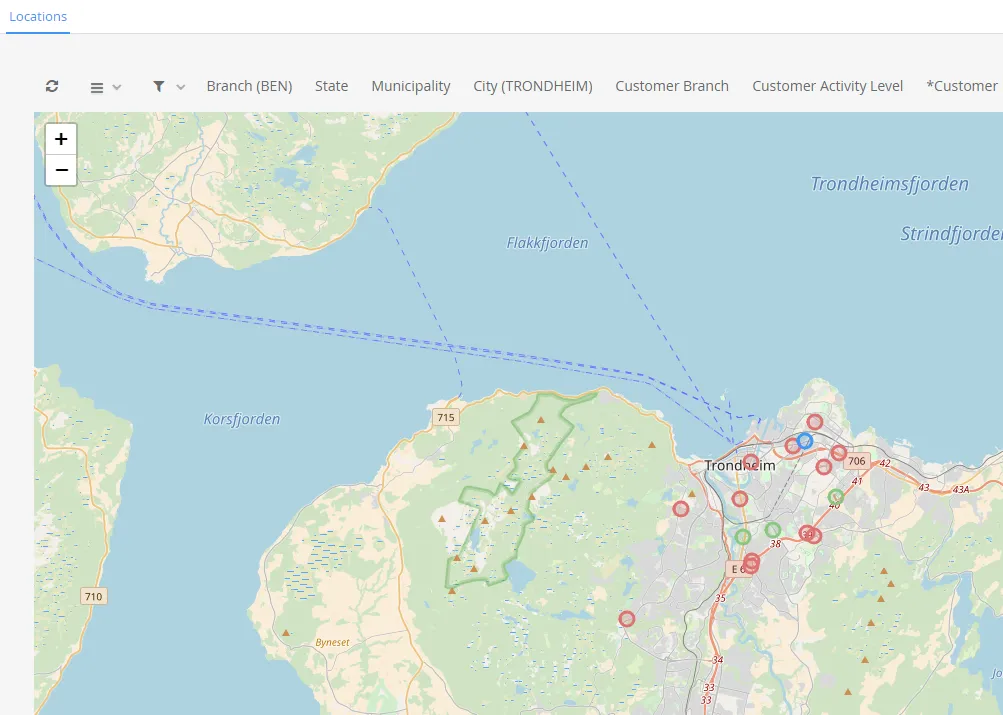
The image shows a street map displaying customer locations as colored markers on a geographic map, with different colors representing different activity levels.
Quickstart
Section titled “Quickstart”To create a Street Map, initialize the graph, add an axis, and use addGraphStreetMapData (lat/long) or addGraphStreetMapUtmData (UTM coordinates).
$olap.addGraph('1','Customer locations','[company_name]','','0')$olap.addGraphAxis('1','1','Amount','')$olap.addGraphStreetMapUtmData("1", "1","1", "[running_number_ts]", "'33'", "'W'", "[customer_utm33_east]", "[customer_utm33_west]", "sum(7)", "[customer_activity_level]=0", "")$olap.addGraphStreetMapUtmData("1", "1","2", "[running_number_ts]", "'33'", "'W'", "[customer_utm33_east]", "[customer_utm33_west]", "sum(7)", "[customer_activity_level]=1", "")$olap.addGraphStreetMapUtmData("1", "1","3", "[running_number_ts]", "'33'", "'W'", "[customer_utm33_east]", "[customer_utm33_west]", "sum(7)", "[customer_activity_level]=2", "")$olap.setGraphColors("1", "red:blue:green")This produces an interactive map with colored markers showing customer locations, with different colors for different activity levels.
Axes setup
Section titled “Axes setup”Street maps require a basic axis setup, though the axis primarily serves organizational purposes.
Required axis setup:
$olap.addGraphAxis('graph_id', 'axis_id', 'Label', '')Example:
$olap.addGraphAxis('1','1','Amount','')Data series
Section titled “Data series”Use addGraphStreetMapData for latitude/longitude coordinates, or addGraphStreetMapUtmData for UTM coordinates.
Latitude/Longitude Method
Section titled “Latitude/Longitude Method”Syntax:
$olap.addGraphStreetMapData( "GraphId", "AxisId", "DataId", "Serie", "Latitude", "Longitude", "Measure", "Filter", "Limit")Parameters:
| Parameter | Required | Description | Example |
|---|---|---|---|
GraphId | Yes | Unique graph identifier | "1" |
AxisId | Yes | The axis ID | "1" |
DataId | Yes | Data identifier/label | "1" |
Serie | Yes | Series column for grouping | "[location_id]" |
Latitude | Yes | Latitude coordinate column | "[lat]" |
Longitude | Yes | Longitude coordinate column | "[lon]" |
Measure | Yes | Value to display | "sum([amount])" |
Filter | No | Additional filter | "[status] = 1" |
Limit | No | Limit number of markers | "100" |
Example:
$olap.addGraphStreetMapData("1", "1","1", "[location_id]", "[latitude]", "[longitude]", "sum([sales])", "", "")UTM Coordinates Method
Section titled “UTM Coordinates Method”Syntax:
$olap.addGraphStreetMapUtmData( "graphId", "axisId", "dataId", "serie", "zone", "letter", "east", "northing", "measure", "filter", "limit")Parameters:
| Parameter | Required | Description | Example |
|---|---|---|---|
graphId | Yes | Unique graph identifier | "1" |
axisId | Yes | The axis ID | "1" |
dataId | Yes | Data identifier/label | "1" |
serie | Yes | Series column | "[running_number_ts]" |
zone | Yes | UTM zone number (in quotes) | "'33'" |
letter | Yes | UTM zone letter (in quotes) | "'W'" |
east | Yes | UTM easting coordinate column | "[customer_utm33_east]" |
northing | Yes | UTM northing coordinate column | "[customer_utm33_west]" |
measure | Yes | Value to display | "sum(7)" or "count(*)" |
filter | No | Additional filter | "[activity_level]=0" |
limit | No | Limit number of markers | "500" |
Example - Multiple series with colors:
$olap.addGraphStreetMapUtmData("1", "1","1", "[id]", "'33'", "'W'", "[east]", "[north]", "sum([value])", "[level]=0", "")$olap.addGraphStreetMapUtmData("1", "1","2", "[id]", "'33'", "'W'", "[east]", "[north]", "sum([value])", "[level]=1", "")$olap.setGraphColors("1", "red:blue:green")Size and layout
Section titled “Size and layout”Control responsive width using setGraphSize. Maps benefit from larger sizes for better visibility.
$olap.setGraphSize("graph_id", "XS12", "SM6", "MD6", "LG6")Recommended sizes:
- Medium:
"XS12", "SM6", "MD6", "LG6"(half width) - Large:
"XS12", "SM8", "MD8", "LG8"(two-thirds width) - Full:
"XS12", "SM12", "MD12", "LG12"(full width)
Common patterns
Section titled “Common patterns”Single location series
Section titled “Single location series”Display one set of locations:
$olap.addGraph("1", "Store Locations", "[store_name]", "","0");$olap.addGraphAxis('1','1','Count','')$olap.addGraphStreetMapData("1", "1","1", "[store_id]", "[latitude]", "[longitude]", "count(*)", "", "")Multiple series with colors
Section titled “Multiple series with colors”Different colors for different categories:
$olap.addGraphStreetMapUtmData("1", "1","1", "[id]", "'33'", "'W'", "[east]", "[north]", "sum([sales])", "[region]='North'", "")$olap.addGraphStreetMapUtmData("1", "1","2", "[id]", "'33'", "'W'", "[east]", "[north]", "sum([sales])", "[region]='South'", "")$olap.setGraphColors("1", "blue:red")Activity level visualization
Section titled “Activity level visualization”Color code by activity:
$olap.addGraphStreetMapUtmData("1", "1","1", "[id]", "'33'", "'W'", "[east]", "[north]", "count(*)", "[activity_level]=0", "")$olap.addGraphStreetMapUtmData("1", "1","2", "[id]", "'33'", "'W'", "[east]", "[north]", "count(*)", "[activity_level]=1", "")$olap.addGraphStreetMapUtmData("1", "1","3", "[id]", "'33'", "'W'", "[east]", "[north]", "count(*)", "[activity_level]=2", "")$olap.setGraphColors("1", "red:yellow:green")Limited markers
Section titled “Limited markers”Show only top locations:
$olap.addGraphStreetMapData("1", "1","1", "[location_id]", "[lat]", "[lon]", "sum([sales])", "", "50")Customer distribution
Section titled “Customer distribution”Map customer locations:
$olap.addGraph("1", "Customer Map", "[company_name]", "","0");$olap.addGraphStreetMapUtmData("1", "1","1", "[customer_id]", "'33'", "'W'", "[utm_east]", "[utm_north]", "count(*)", "", "")Troubleshooting
Section titled “Troubleshooting”Map not showing
Section titled “Map not showing”- Check: Ensure you use
addGraphStreetMapDataoraddGraphStreetMapUtmData(notaddGraphData) - Check: Verify coordinate columns contain valid numeric values
- Check: Ensure coordinates are within valid ranges (lat: -90 to 90, lon: -180 to 180)
- Check: UTM zone and letter must be in quotes:
"'33'"not"33"
Markers in wrong location
Section titled “Markers in wrong location”- Issue: Markers appear in wrong place on map
- Fix: Verify coordinate columns are correct (not swapped lat/lon or east/north)
- Fix: Check UTM zone matches your data’s coordinate system
- Fix: Ensure coordinates use same system (all lat/lon or all UTM)
No markers visible
Section titled “No markers visible”- Issue: Map shows but no markers
- Check: Verify filter doesn’t exclude all data
- Check: Ensure measure returns valid values (not all NULL)
- Check: Check if
limitis too restrictive - Check: Verify coordinate columns have data (not NULL)
Wrong coordinate system
Section titled “Wrong coordinate system”- Issue: Using wrong method for coordinates
- Fix: Use
addGraphStreetMapDatafor latitude/longitude - Fix: Use
addGraphStreetMapUtmDatafor UTM coordinates - Fix: Don’t mix systems - all markers must use same coordinate type
Too many markers
Section titled “Too many markers”- Issue: Map cluttered with markers
- Fix: Use
limitparameter to restrict number:$olap.addGraphStreetMapData("1", "1","1", "[id]", "[lat]", "[lon]", "sum([value])", "", "100") - Fix: Filter to relevant subset before mapping
Q: Can I use both lat/lon and UTM in the same map?
A: No, all markers must use the same coordinate system. Choose either lat/lon or UTM for all series.
Q: What UTM zones are supported?
A: Contact your consultant for available UTM zones. Common zones include 33W (Norway), 32U (Central Europe), etc.
Q: How do I zoom and pan the map?
A: Maps are interactive - users can zoom and pan directly in the browser. This is handled automatically by the map component.
Q: Can I filter data on the map?
A: Yes, use filter expressions in addGraphStreetMapData or filter in addGraph method. Standard report filtering also applies.
Q: How many markers can I show?
A: Performance depends on data volume. Use limit to restrict markers (e.g., top 100-500). Too many markers can slow rendering.
Q: Can I customize marker colors?
A: Yes, use setGraphColors to assign colors. Different series get different colors automatically.
Q: What’s the difference between lat/lon and UTM?
A: Lat/lon uses degrees (-90 to 90, -180 to 180). UTM uses meters in a projected coordinate system. Use what your data provides.
Q: Can I show marker sizes based on values?
A: Marker size may be determined by the measure value, depending on map provider capabilities. Contact your consultant for details.
Related
Section titled “Related”- Graph Method Overview - Complete reference for all graph methods
- addGraphStreetMapData - Lat/lon method
- addGraphStreetMapUtmData - UTM method
- setGraphColors - Custom marker colors