Report functionality
Within your menu, you will be given access to a number of reports. Based on the setup done by your administrator, the naming of the reports will be specific to your company. This guide will give an overview of general functionality within a report.
Multidimensional report overview
Section titled “Multidimensional report overview”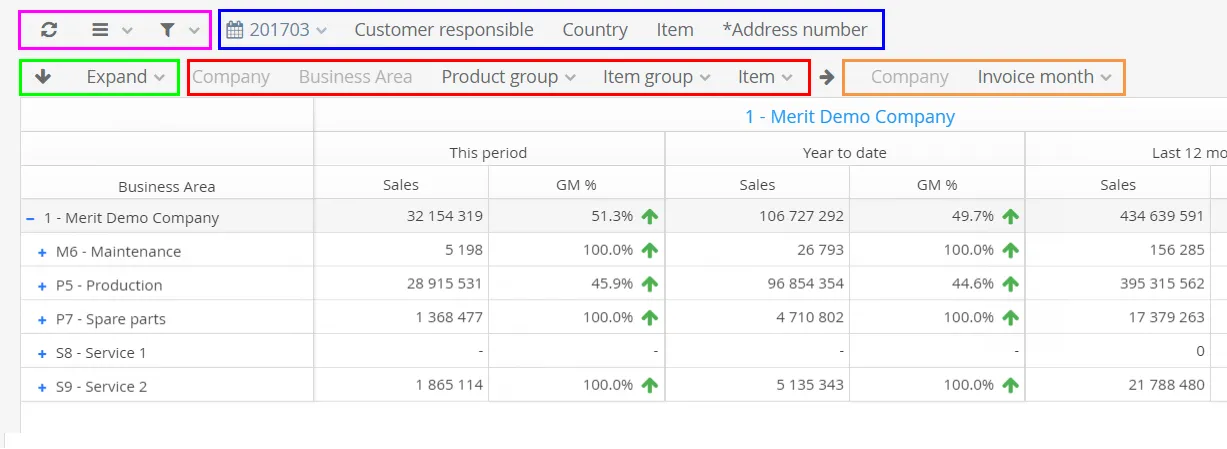
| Function | Description |
|---|---|
| Refresh | Reload the report, removes all user filters/changes |
Menu 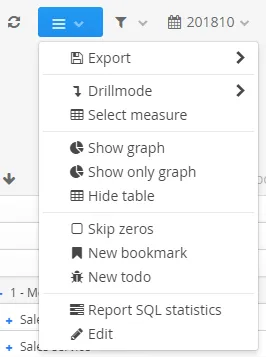 | |
Filter 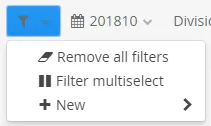 |
|
| Selected Filters | Filters predefined by the administrators and added by you will appear in this section of the report |
| Expand | This arrow will expand the report in the “Y” direction, with the next level in the RED area |
Expand 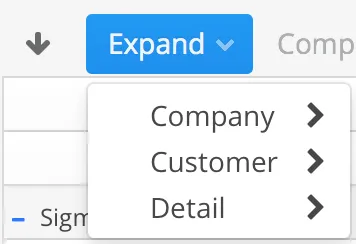 | This menu will add the dimension you select to the next level in the RED area. |
| Y-Dimension | The dimensions selected to be the traditional drill path for the report in the Y direction |
| X-Dimension | The dimensions selected to be the traditional drill path for the report in the X direction |
Navigating the report
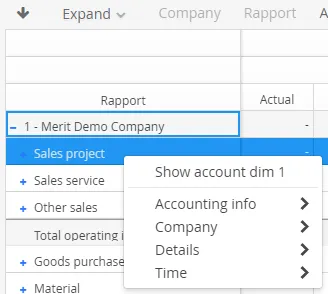
Section titled “Navigating the report”If you want to show the next level just for one row you can click the [blue]#+#, or the text. It is also possible to select any other dimension by opening the drill menu. This menu is opened by “right click”
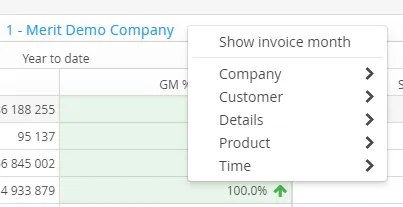
It is also possible to drill/open dimensions on the X-axis, this is done by right-click” on the title line (outside the text):
The report can be collapsed by using the ”-” sign on the dimensions.
Linked content
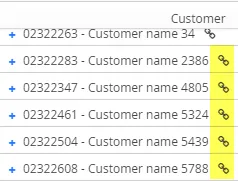
Section titled “Linked content”The dimensions can be linked to records in Deem Insight, or to other reports. If this is the case, a symbol will appear on the record:
Sorting
Section titled “Sorting”![]()
By default, with no ((sorting)) on measures, the report is sorted by the selected dimension. By clicking a measure header, it will be sorted descending, click once more for ascending, and once again to remove the sorting.
Graph functionality
Section titled “Graph functionality”Graphs are used to visualize values and to filter content. On mouse over, the actual values are shown:
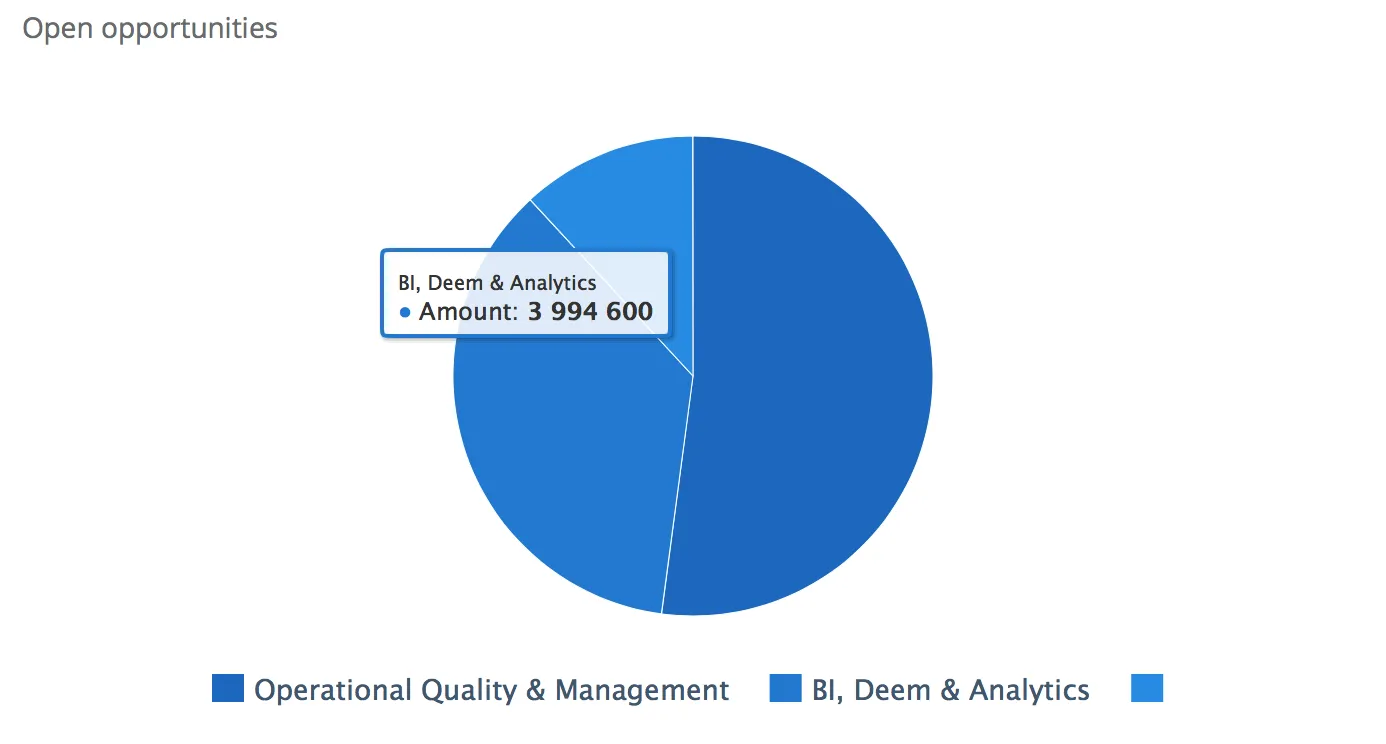
When clicking this section of a graph, the entire report is filtered using this dimension. The filter used will be shown both in the graph itself, and also added to the report filters.
Export
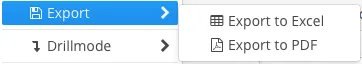
Section titled “Export”![]()
The export functionality covers Excel and PDF download of the report, and it will contain data currently showing in the report area.
The export dialog gives you as a user some possibilities to format the output
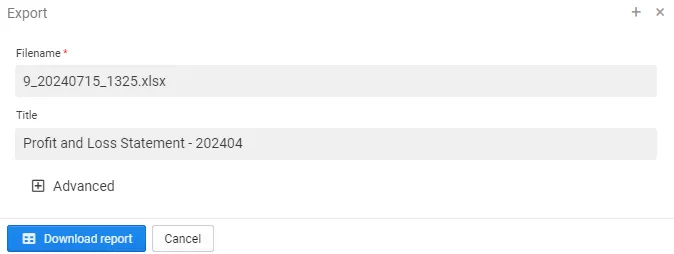
- Name: The file name
- Title: The report title in the document
Using the “Advanced options” you can also change the following options:
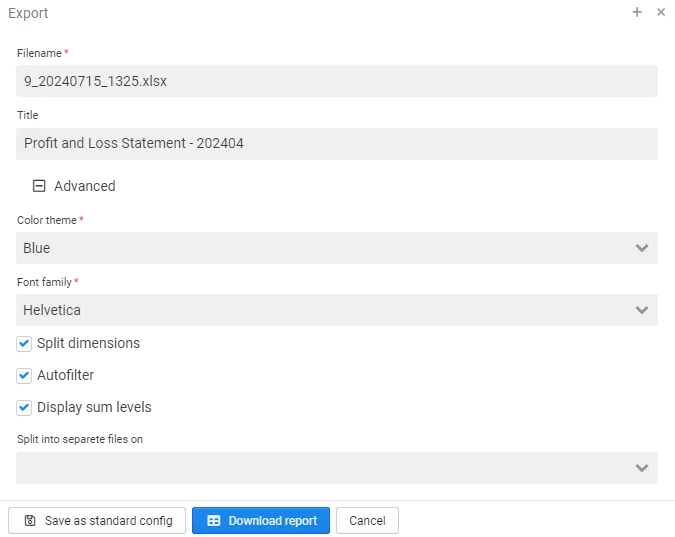
- Color Theme: The colors within the report
- Font: Options to use fonts that are mono-spaced (Courier)
- Split Dimensions: Dimensions where e.g. id and name is combined are split into two columns
- Autofilter
- Sum levels in export
- Split export in detail files on
Drillmode
Section titled “Drillmode”![]()
The drill mode controls the expansion of the dimension in the Y-direction, and can also be used to expand several levels of the report with one click.
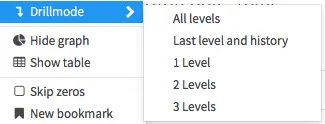
All levels
Section titled “All levels”will keep all the data:
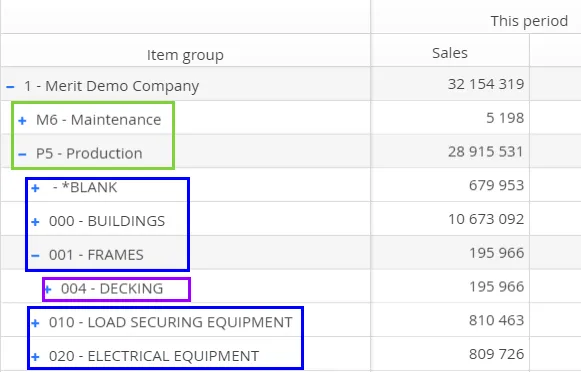
So, as the report is drilled to see the details in blue, it will still keep the other green elements.
Last level and history
Section titled “Last level and history”will focus only on the drill:
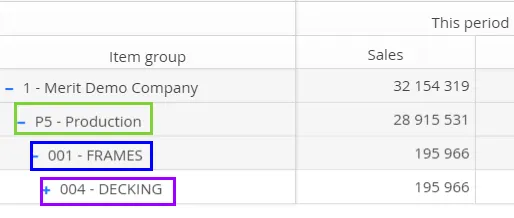
So, as the report is drilled to see the details in blue, it will only keep the parent element.
1/2/3 Levels
Section titled “1/2/3 Levels”opens all elements 1,2 or 3 levels
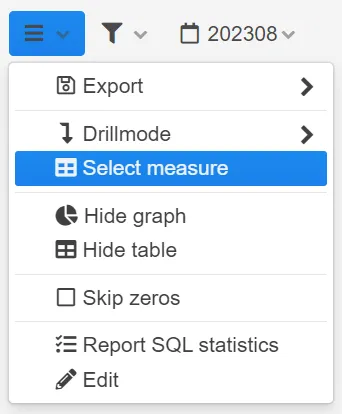
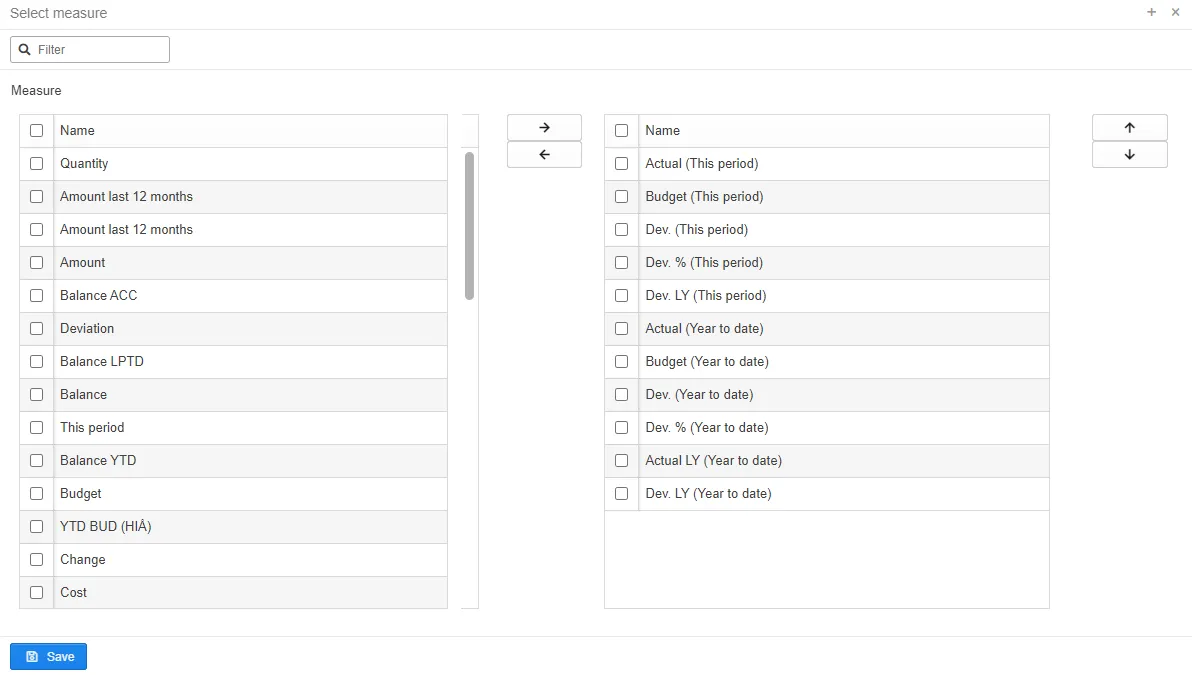
Select measure
Section titled “Select measure”It is possible to hide or add measures in a report, this is done by selecting ((Select measure)) in the menu. Please note that this will not change the original settings for the report. These changes apply only for your session. You can of course save it as a bookmark for later use.
Show/hide graph/table
Section titled “Show/hide graph/table”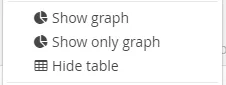
Show/hide graph/table are used to show and hide the graphs and table in the report.
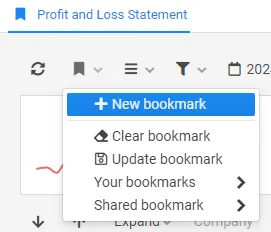
Report bookmark
Section titled “Report bookmark”A bookmark enables you to save the current state of a report, and it is possible to use as a shortcut within the system. To create a new bookmark, select new bookmark in the bookmark menu.
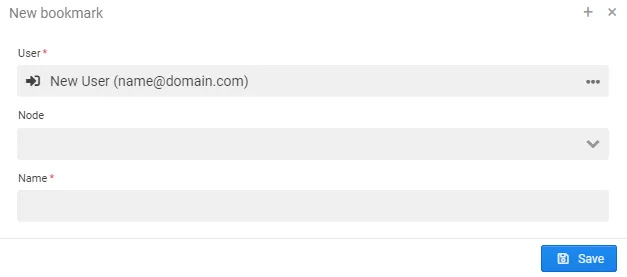
When creating the bookmark, you will be asked to choose the name.
Your bookmarks are possible to reach from your home page.

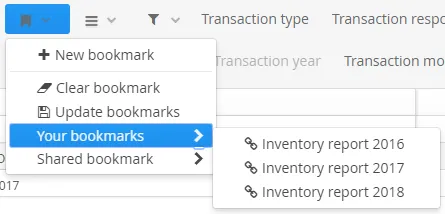
You can also reach your bookmarks from the report the bookmark originates from:
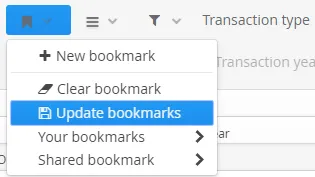
You can change an existing bookmark by choosing the bookmark, do the changes needed and select update bookmark.
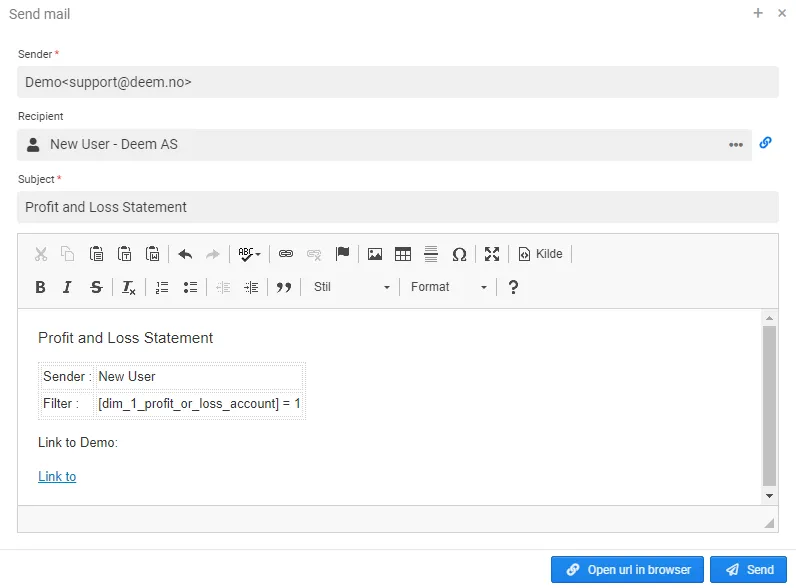
Deem Insight allows you to send bookmarks by email, or send a URL link to the bookmark.
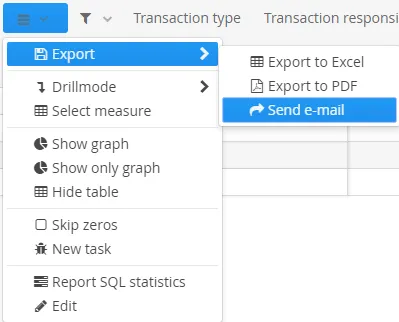
If Deem Insight has been set up to send email, you can select send. Another option is to open url in browser and copy and send the URL.

In Deem Insight you can also share bookmarks, these will only appear in report bookmark menu, under shared:
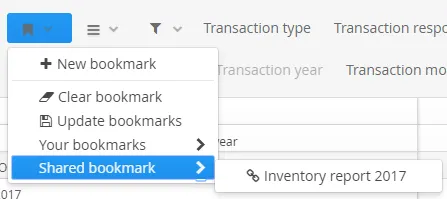
The possibility to share bookmarks are restricted by role access. Please contact your superuser for further assistance.
New task
Section titled “New task”![]()
A task can create an activity or issue. The functionality on activities/issues are further explained in the Activity section of this document.
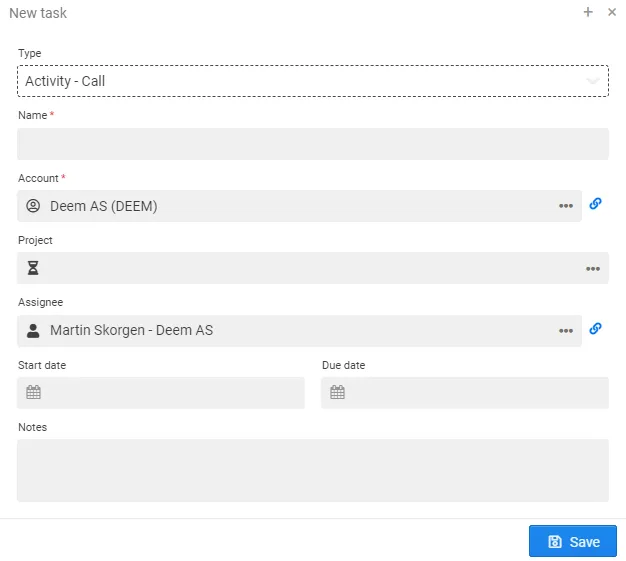
When creating the task from a report, the activity/issue will also have the current report exported as an Excel attached.