Spiderweb
Overview
Section titled “Overview”- Type: Two-dimensional polar/radar chart
- Dimensions: No traditional X-axis; Y-axis extends from center (0) outward proportionally to value
- Use cases: Compare multiple dimensions/metrics, show performance across categories, display multi-attribute profiles
- Special features: Can be combined with other chart types (e.g., columns) in the same graph
- Visual: Circular web with axes radiating from center, values plotted as distance from center
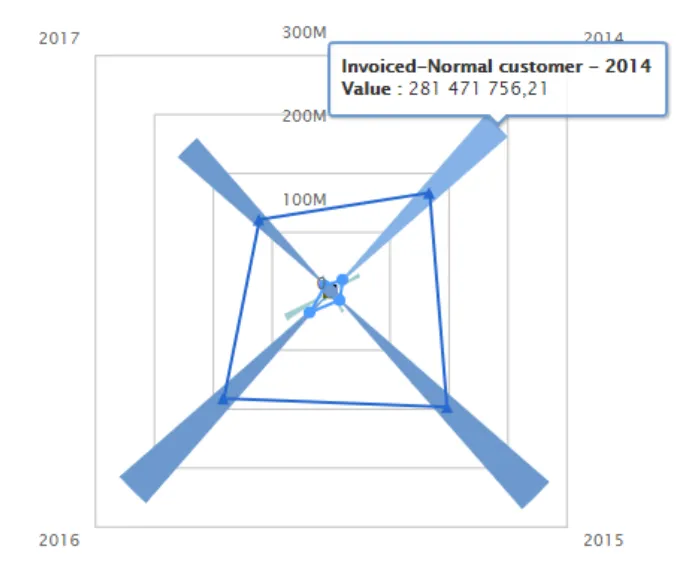
The image shows a combined chart with columns (Invoiced) and a spiderweb overlay (COGS), demonstrating how spiderweb can be combined with other chart types for multi-dimensional visualization.
Quickstart
Section titled “Quickstart”To create a Spiderweb chart, initialize the graph, add data with chart_type: "spiderweb". Can be combined with other types.
$olap.addGraph("2","Sales - customer-group","[invoice_year]","[invoice_year]>=2014","2");$olap.addGraphData("2","1","Invoiced-","[customer_group_description]","sum([invoiced_amount_dcur])","column","","","");$olap.addGraphData("2","2","COGS-","[customer_group_description]","sum([issued_cost_amount_dcur])","spiderweb","","","");$olap.setGraphColors("2", "#0066cc:#9999cc#669933:#3399FF")$olap.setGraphSize("2","XS12","SM3","MD3","LG4")$olap.setGraphDataSkipZeros("2", "3", "3")$olap.hideGraphLegend('2')This produces a combined chart with columns showing invoiced amounts and a spiderweb overlay showing COGS, both by customer group.
Axes setup
Section titled “Axes setup”Spiderweb charts don’t use traditional axes setup. The Y-axis extends from center (0) outward.
Note: Spiderweb typically doesn’t require addGraphAxis calls, as it uses a polar coordinate system. However, if combined with other chart types, set up axes for those types.
If combining with other chart types:
$olap.addGraphAxis('graph_id', 'axis_id', 'Label','false')// Spiderweb series can use same or different axis_idExample - Combined setup:
$olap.addGraphAxis('2', '1', 'Amount','false') // For column series// Spiderweb uses axis_id '2' but doesn't need explicit axis setupData series
Section titled “Data series”Add data using addGraphData with chart_type: "spiderweb". Often combined with other chart types.
Syntax:
$olap.addGraphData( "graph_id", "axis_id", "dataseries_label", "series", "measure", "spiderweb", "", "filter", "limit", "orderby")Parameters:
| Parameter | Required | Description | Example |
|---|---|---|---|
graph_id | Yes | Unique graph identifier | "2" |
axis_id | Yes | Axis ID (can be different from other series) | "2" |
dataseries_label | Yes | Label in legend | "COGS-" |
series | Yes | Column for categories (creates axes) | "[customer_group]" |
measure | Yes | Value determining distance from center | "sum([amount])" |
chart_type | Yes | Must be "spiderweb" | "spiderweb" |
aggregation | No | Not used (use "") | "" |
filter | No | Additional filter | "[status] = 1" |
limit | No | Limit number of categories | "10" |
orderby | No | Sort method | "M" |
Example - Standalone spiderweb:
$olap.addGraph("1", "Performance Profile", "[metric]", "","0");$olap.addGraphData("1","1","Score","[metric]","avg([score])","spiderweb","","","","")Example - Combined with columns:
$olap.addGraphData("2","1","Invoiced","[category]","sum([invoiced])","column","","","");$olap.addGraphData("2","2","COGS","[category]","sum([cogs])","spiderweb","","","");Example - Hide zeros:
$olap.setGraphDataSkipZeros("2", "axis_id", "3") // Hide zeros and NULLsSize and layout
Section titled “Size and layout”Control responsive width using setGraphSize. Spiderweb charts work well at smaller to medium sizes.
$olap.setGraphSize("graph_id", "XS12", "SM3", "MD3", "LG4")Recommended sizes:
- Small:
"XS12", "SM3", "MD3", "LG3"(quarter width) - Medium:
"XS12", "SM4", "MD4", "LG4"(third width) - Large:
"XS12", "SM6", "MD6", "LG6"(half width)
Common patterns
Section titled “Common patterns”Standalone spiderweb
Section titled “Standalone spiderweb”Multi-dimensional profile:
$olap.addGraph("1", "Team Performance", "[metric]", "","0");$olap.addGraphData("1","1","Score","[metric]","avg([performance_score])","spiderweb","","","","")Combined with columns
Section titled “Combined with columns”Overlay spiderweb on column chart:
$olap.addGraph("1", "Sales Analysis", "[category]", "","0");$olap.addGraphAxis('1', '1', 'Amount','false')$olap.addGraphData("1","1","Revenue","[category]","sum([revenue])","column","","","");$olap.addGraphData("1","2","Cost %","[category]","sum([cost])/sum([revenue])*100","spiderweb","","","");Performance comparison
Section titled “Performance comparison”Compare multiple entities:
$olap.addGraph("1", "Department Comparison", "[department]:[metric]", "","0");$olap.addGraphData("1","1","-","[department]:[metric]","avg([score])","spiderweb","","","","")Custom colors
Section titled “Custom colors”Assign distinct colors:
$olap.setGraphColors("1", "#0066cc:#9999cc#669933:#3399FF")Hide legend
Section titled “Hide legend”When combined, hide legend for clarity:
$olap.hideGraphLegend('graph_id')Troubleshooting
Section titled “Troubleshooting”Spiderweb not showing
Section titled “Spiderweb not showing”- Check: Ensure
chart_typeis exactly"spiderweb"(lowercase) - Check: Verify series column has valid values
- Check: Confirm measure returns numeric values
Web shape distorted
Section titled “Web shape distorted”- Issue: Spiderweb appears stretched or compressed
- Fix: Ensure chart has square or near-square aspect ratio (use similar width/height)
- Fix: Check if combined with other chart types is affecting layout
Too many categories
Section titled “Too many categories”- Issue: Web cluttered with many axes
- Fix: Use
limitto show only top N categories:$olap.addGraphData("1","1","Score","[category]","sum([value])","spiderweb","","","10","M");
Values not visible
Section titled “Values not visible”- Issue: Points too close to center
- Fix: Check measure scale - values may be too small relative to max
- Fix: Normalize values or adjust measure calculation
Combined chart confusion
Section titled “Combined chart confusion”- Issue: Hard to distinguish spiderweb from other series
- Fix: Use
setGraphColorsto assign distinct colors - Fix: Use
hideGraphLegendif legend is cluttered - Fix: Consider using spiderweb alone if combination is too complex
Q: Can I use spiderweb alone?
A: Yes, but it’s often more effective when combined with other chart types (columns, lines) for richer visualization.
Q: How many categories should I use?
A: 5-10 categories work best. More than 10 creates a cluttered web that’s hard to interpret.
Q: What’s the difference between spiderweb and radar charts?
A: They’re the same thing - spiderweb is the term used in this system, radar is the common name.
Q: Can I have multiple spiderweb series?
A: Yes, but multiple webs can overlap and become confusing. Consider using different chart types for comparison.
Q: How do I customize colors?
A: Use setGraphColors to assign a color palette. Colors apply to categories in order.
Q: Can I hide the legend?
A: Yes, use hideGraphLegend with the graph ID. Useful when combined with other chart types.
Q: Why combine spiderweb with columns?
A: Columns show absolute values clearly, while spiderweb shows relative proportions. Together they provide complementary views.
Q: How do I filter which categories appear?
A: Use the filter parameter in addGraphData or filter in addGraph method. You can also use limit to show top N.
Related
Section titled “Related”- Graph Method Overview - Complete reference for all graph methods
- Combined - How to combine chart types
- Column - Column charts for combination
- setGraphColors - Custom color assignment
- hideGraphLegend - Hide legend