Dashboard Scripts
Overview
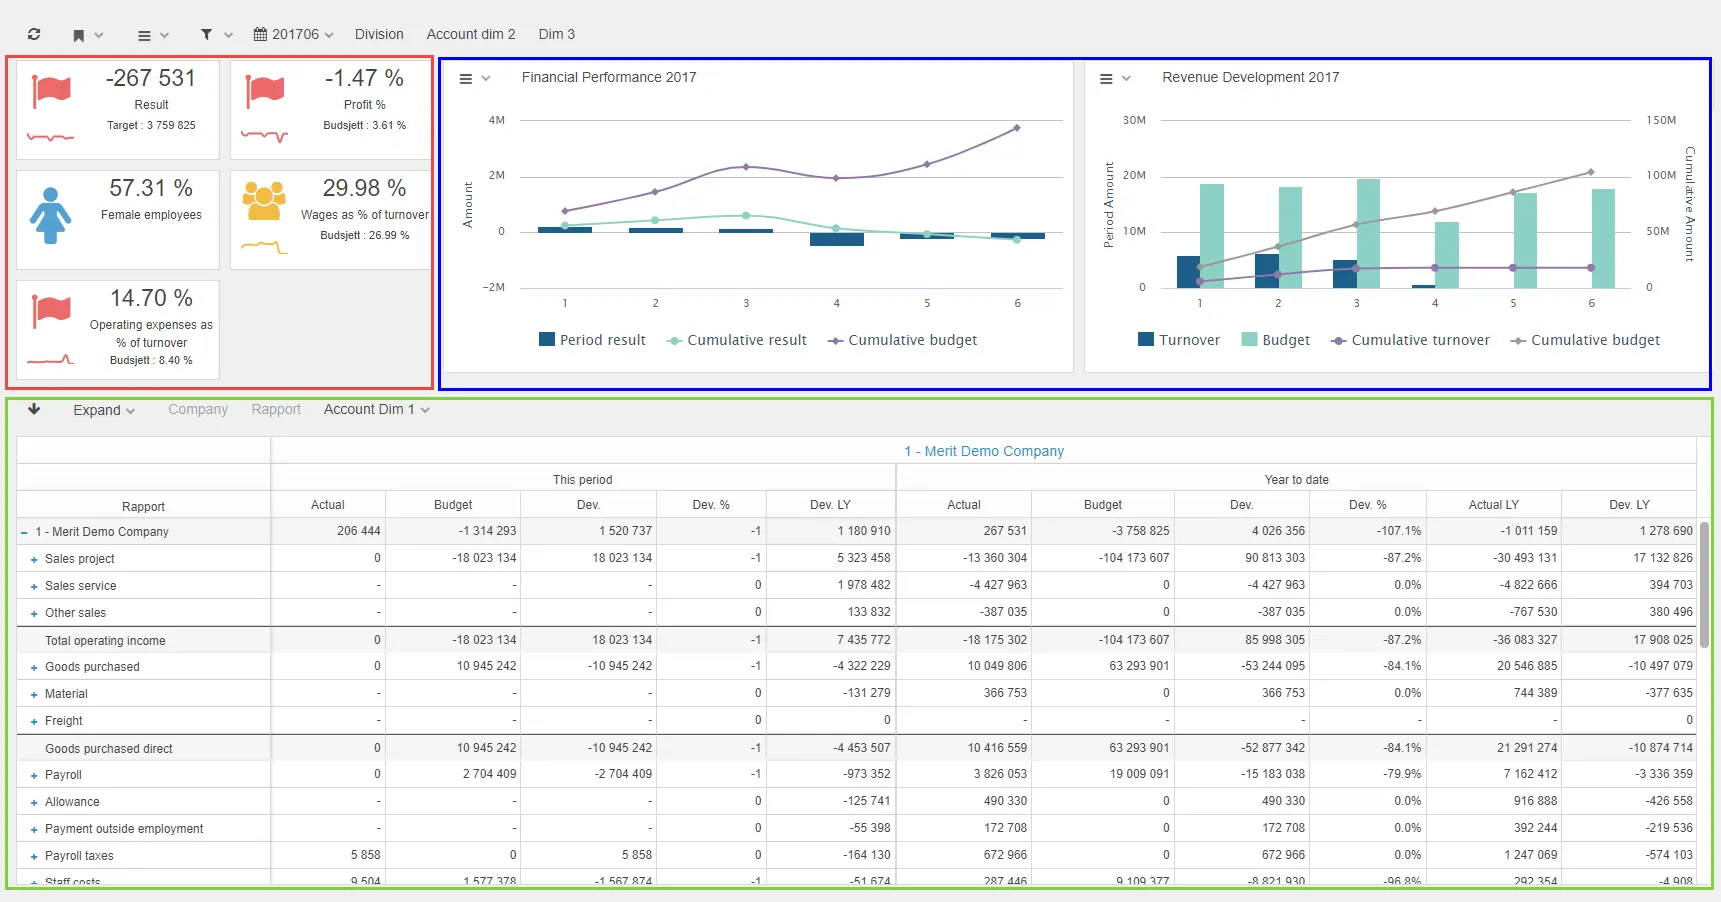
Section titled “Overview”Dashboard scripts control the layout, positioning, and sizing of dashboard elements (graphs, KPIs, and drill reports) using Bootstrap grid classes. This enables responsive layouts that look good on mobile, tablet, and desktop devices.
Dashboard Methods
Section titled “Dashboard Methods”setLayoutGraph
Section titled “setLayoutGraph”Sets the position and size of the graph area in the dashboard.
$olap.setLayoutGraph("first","XS12","SM12","MD12","LG12")Parameters:
- Options for placing: Either
"first"or"last" - Size parameters: Sets the width of the graph area using Bootstrap code
setLayoutGraphPosition
Section titled “setLayoutGraphPosition”Sets only the position of the graph area.
$olap.setLayoutGraphPosition("first")Parameters:
- Options for placing: Either
"first"or"last"
setLayoutGraphSize
Section titled “setLayoutGraphSize”Sets only the size of the graph area.
$olap.setLayoutGraphSize("XS12","SM12","MD12","LG12")Parameters:
- Sets the width of the graph area using Bootstrap code
setLayoutGridSize
Section titled “setLayoutGridSize”Sets the width of the drillreport area.
$olap.setLayoutGridSize("XS12","SM12","MD12","LG12")Parameters:
- Sets the width of the drillreport area using Bootstrap code
setLayoutKpi
Section titled “setLayoutKpi”Sets the position and size of the KPI area in the dashboard.
$olap.setLayoutKpi("first","XS12","SM12","MD12","LG12")Parameters:
- Options for placing: Either
"first"or"last" - Size parameters: Sets the width of the KPI area using Bootstrap code
setLayoutKpiPosition
Section titled “setLayoutKpiPosition”Sets only the position of the KPI area.
$olap.setLayoutKpiPosition("first")Parameters:
- Options for placing: Either
"first"or"last"
setLayoutKpiSize
Section titled “setLayoutKpiSize”Sets only the size of the KPI area.
$olap.setLayoutKpiSize("XS12","SM12","MD12","LG12")Parameters:
- Sets the width of KPI area using Bootstrap code
Dashboard Examples
Section titled “Dashboard Examples”Examples can be found in https://support.deem.no/demo, folder: Examples, Dashboard example 1,2,3
Example 1: Graph on the right, grid on the left
Section titled “Example 1: Graph on the right, grid on the left”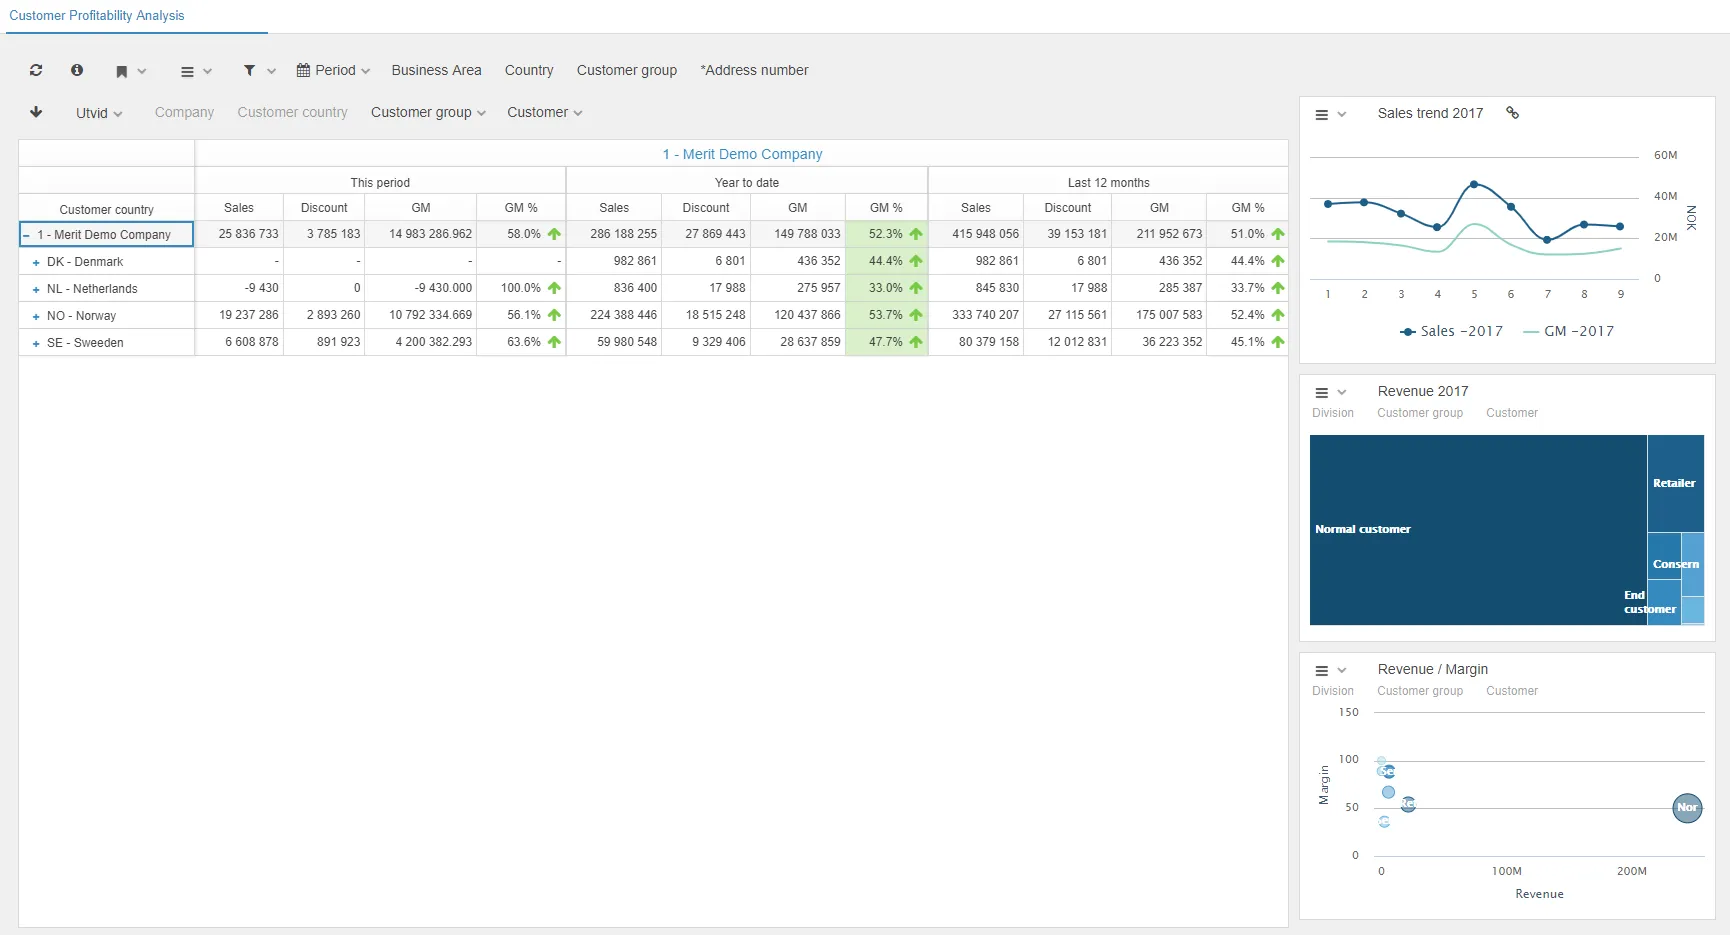
$olap.setLayoutGraph("last","XS12","SM12","MD3","LG3")$olap.setLayoutGridSize("XS12","SM12","MD9","LG9")$olap.setMainGraphHeight(33)This example places the graph on the right side (last) taking up 3/12 of the width on medium and large screens, with the drillreport grid taking up 9/12 on the left.
Example 2: KPI on the right, grid and graph stacked
Section titled “Example 2: KPI on the right, grid and graph stacked”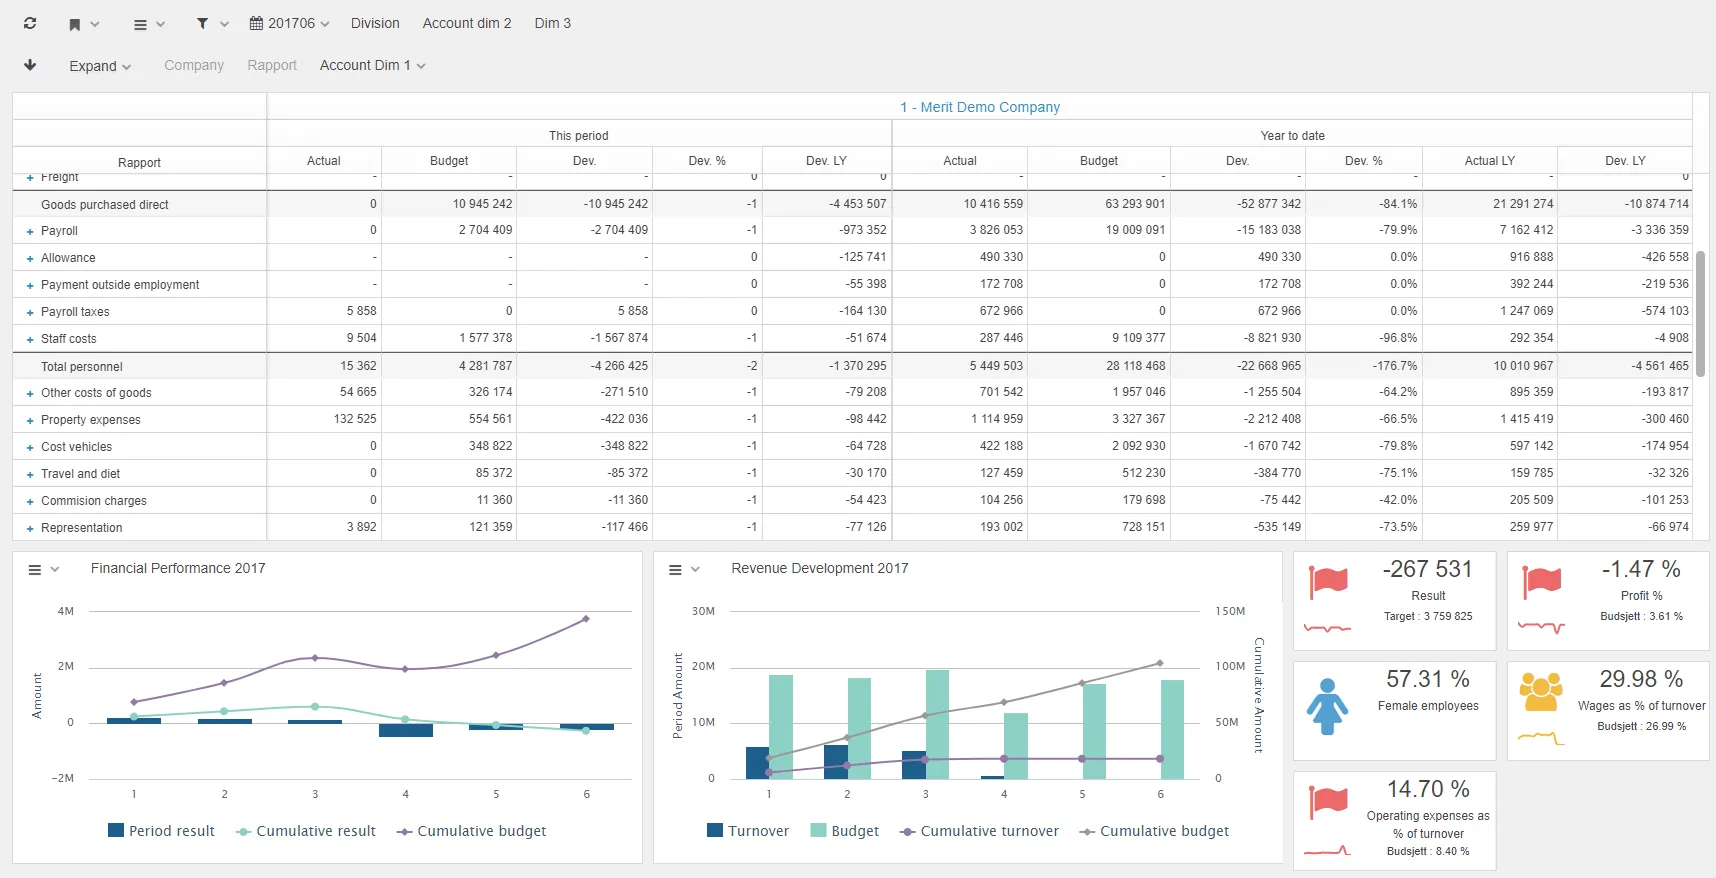
$olap.setLayoutKpi("last","XS12","SM12","MD3","LG3")$olap.setLayoutGridSize("XS12","SM12","MD9","LG12")$olap.setGridHeight(60)$olap.setLayoutGraph("last","XS12","SM12","MD12","LG9")This example places KPIs on the right (3/12 width), with the grid taking full width on large screens and 9/12 on medium, and the graph below taking 9/12 on large screens.
Example 3: Multiple KPI rows with grid and graph
Section titled “Example 3: Multiple KPI rows with grid and graph”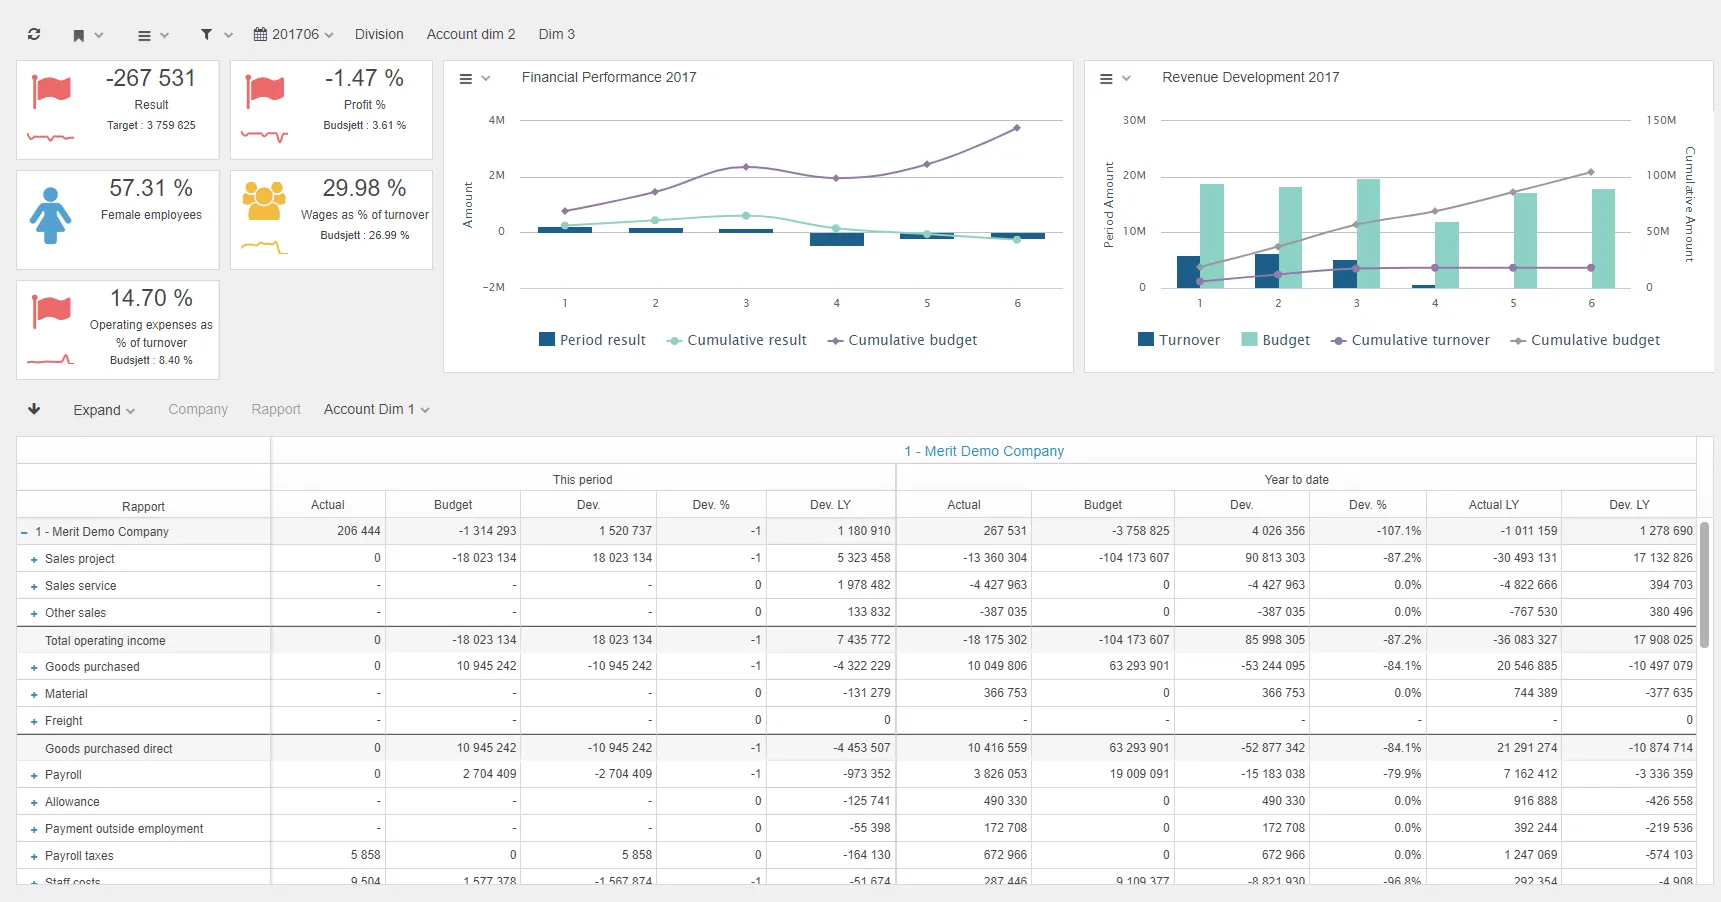
$olap.setNumberOfKpiRows(3)$olap.setLayoutGridSize("XS12","SM12","MD9","LG12")$olap.setGridHeight(60)$olap.setLayoutGraph("first","XS12","SM12","MD12","LG9")$olap.setLayoutKpi("first","XS12","SM12","MD3","LG3")This example shows 3 rows of KPIs on the left (3/12 width), with the grid taking full width on large screens, and the graph positioned first taking 9/12 on large screens.
Bootstrap Grid System
Section titled “Bootstrap Grid System”Many of the scripts in these chapters use Bootstrap code to set width of the elements used. Page width is divided in 12 parts, so 4 equal parts are 3-3-3-3 etc. The different screen sizes can be used to create a new row in the layout. Using LG3 (4 parts) on a large screen might look better in two rows on an iPad MD6 (2 parts).
Screen Size Classes:
- XS_: Size on extra small (phone screen) XS1 to XS12 (XS12 recommended) < 768 pixels
- SM_: Size on devices with screen width > XS, < 992 px
- MD_: Size on devices with screen width > SM, < 1200 px
- LG_: Size on devices with screen width > MD
For more information, see Bootstrap CSS Grid.
Troubleshooting
Section titled “Troubleshooting”Common Issues
Section titled “Common Issues”Elements not positioning correctly:
- Ensure KPIs are placed either before or after graph/grid elements
- Check that each element type is only used once per dashboard area
- Verify Bootstrap grid classes are correctly formatted (XS12, SM12, etc.)
Layout not responsive:
- Make sure you’ve specified sizes for all screen sizes (XS, SM, MD, LG)
- Test on different screen sizes to verify responsive behavior
- Consider using different sizes for different breakpoints (e.g., MD6 for tablets, LG3 for desktops)
Grid not adjusting:
- Remember that grid scripts don’t have first/last options - they adjust automatically
- The drillreport must be based on the datasource the report is built on
Related
Section titled “Related”- Graphs, Tables and KPIs - Overview of dashboard elements
- Creating a Report - Report configuration basics
- Graphs - Graph configuration
- KPIs - KPI configuration
- Tables - Table configuration