Creating a Report
Overview
Section titled “Overview”Deem Insight supports drill reports with two main categories:
| Feature | Periodic | All data |
|---|---|---|
| Filter | Should contain a period selection | No specific requirements |
| Measures | Measures should be grouped in periodic groups (YTD, TP, etc.) | No specific requirements |
| Zero values | Null/0 values might appear because dimension exists, but not in selected period | No specific requirements |
| Dimensions | No specific requirements | No specific requirements |
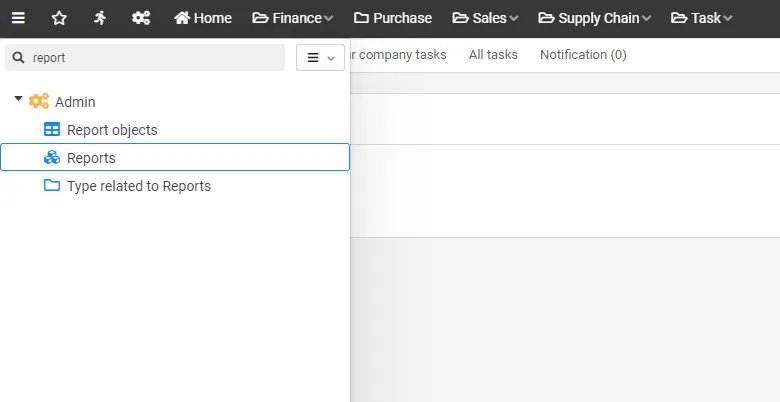
To create or modify reports, the user must have analytics administration access. Reports can be edited from a report by choosing menu and edit, or you can find the report in the “admin” section:
The report management is divided into several tabs, each explained in the following sections.
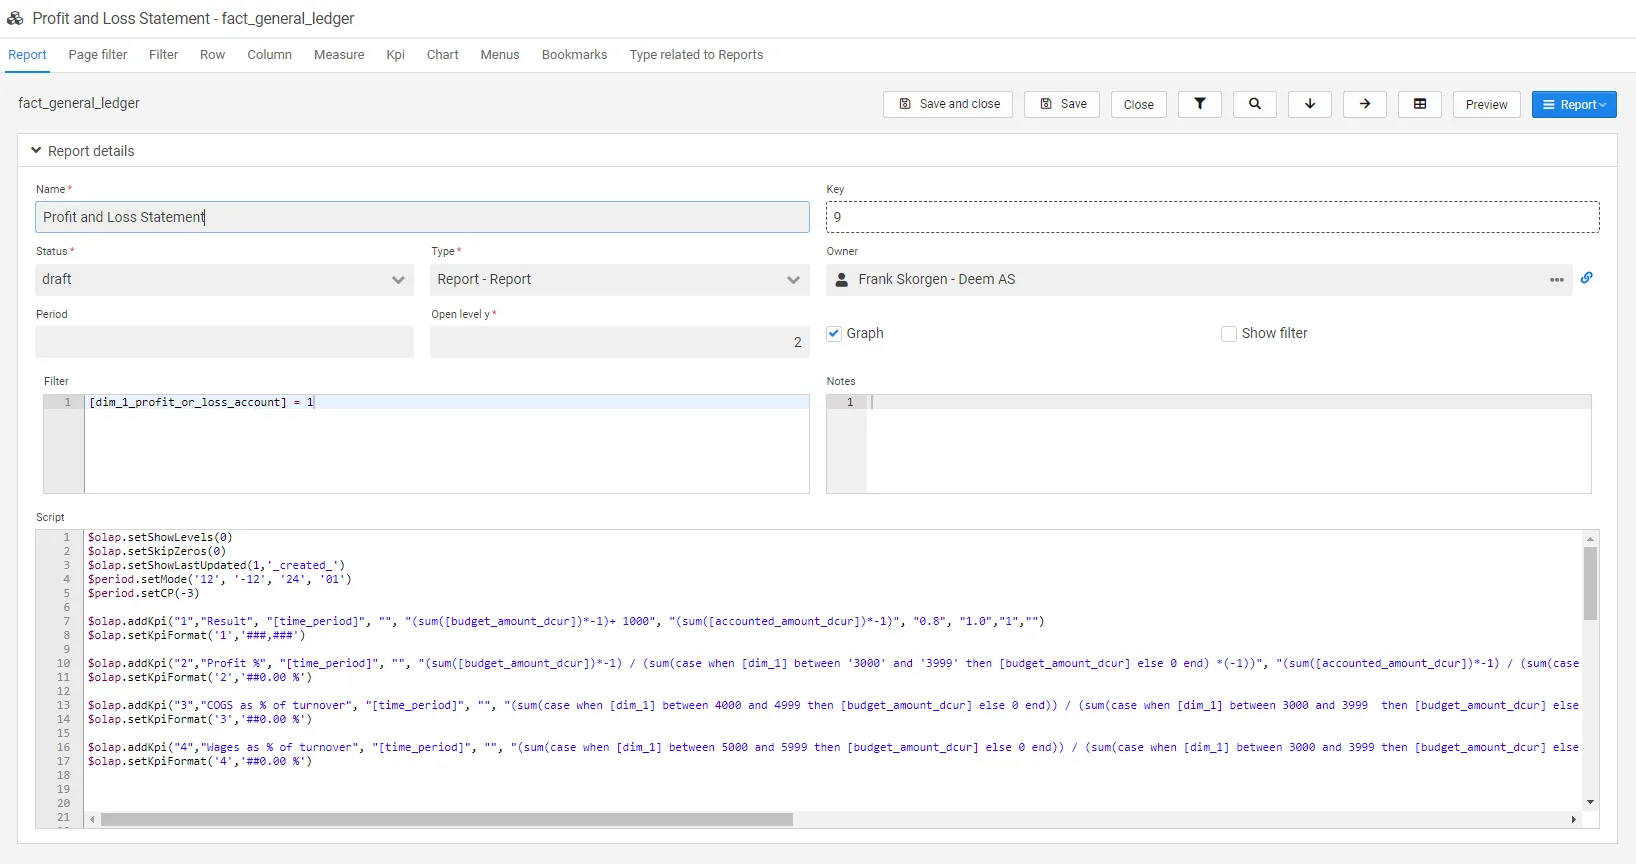
Report Settings
Section titled “Report Settings”The report settings tab contains the core configuration for your report.
| Field | Description |
|---|---|
| Key | Report key (unique identifier) |
| Name | The default report name (can be changed when adding it to the menu) |
| Type | Currently just “Report” |
| Status | Set the status of the report (statuses can be configured) |
| Owner | The report owner (select from users) |
| Period | Period configuration |
| Open level y | Number of levels opened as a default for the report |
| Graph | Show/hide graphs |
| Show filter | Show/hide filter |
| Notes | Freetext field. The text will be shown in the report’s help button |
| Filter | Filters all content in report, graphs and KPIs |
| Script | All report/graph/addon table/KPI functions are set here |
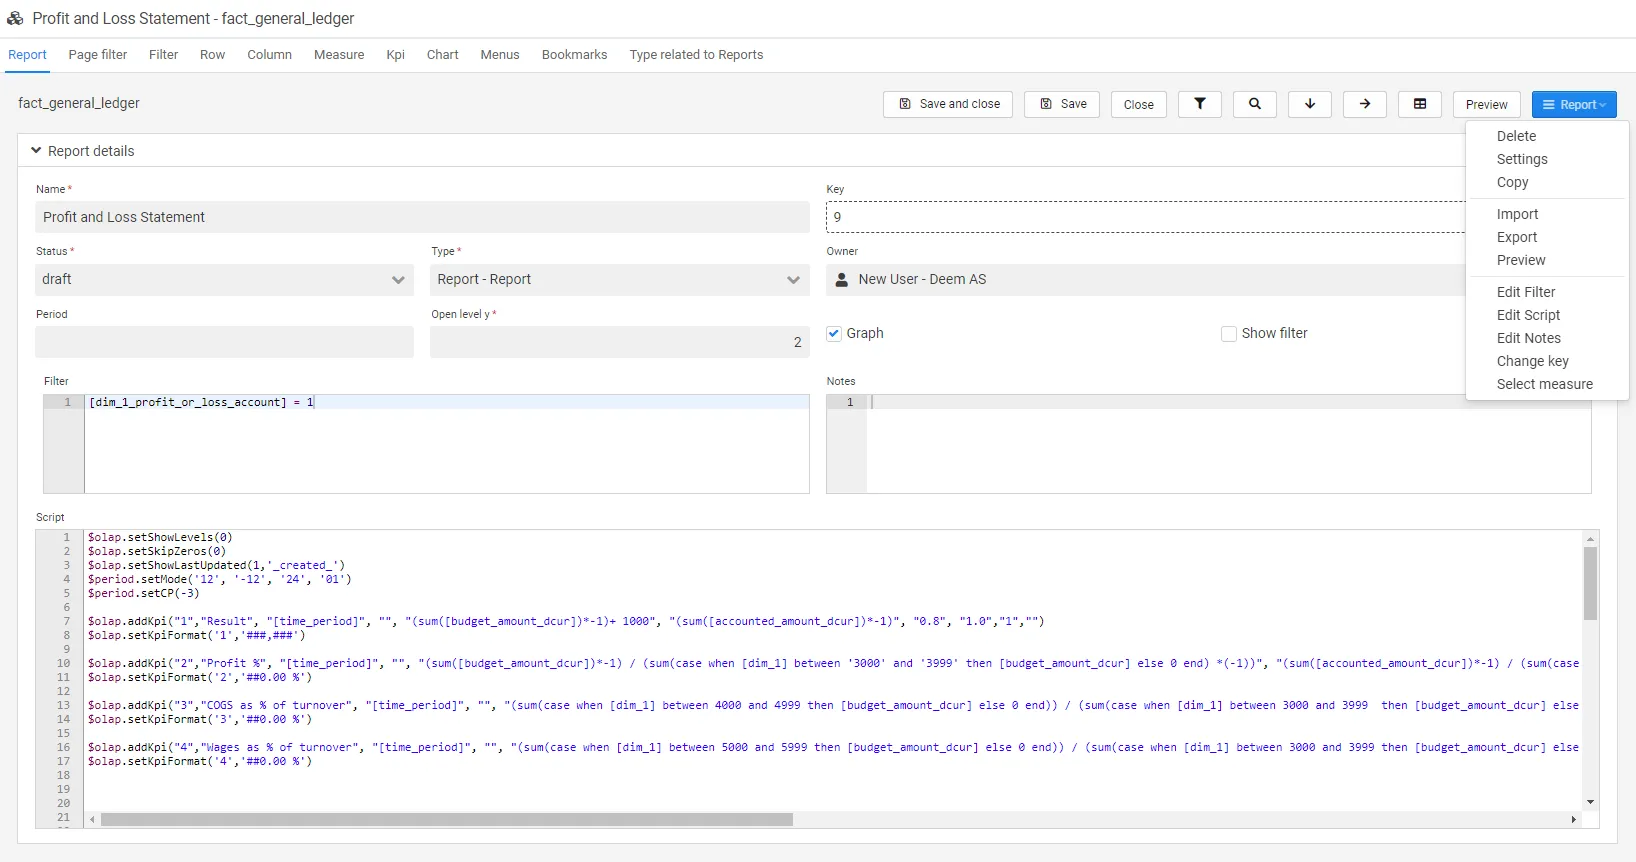
Report Actions
Section titled “Report Actions”| Field | Description |
|---|---|
| Copy | Copy the report |
| Delete | Delete the report |
| Import | Import another report |
| Export | Export current report |
| Preview | Preview the report |
| Edit filter | Opens a new window to edit the filter. Contains help functions for scripts |
| Edit script | Opens a new window to edit the script. Contains help functions for scripts, colors and icons |
| Edit notes | Opens a new window to edit the notes |
| Change key | Change the report key |
| Select measure | Opens a select measure box |
Page Filter
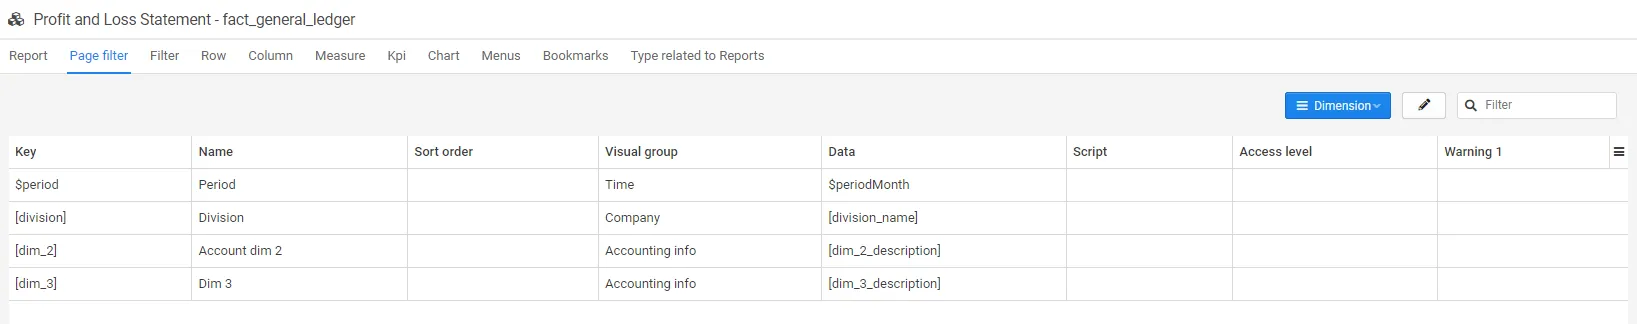
Section titled “Page Filter”Page filters can be used to add quick access to filters which are frequently used in the report.
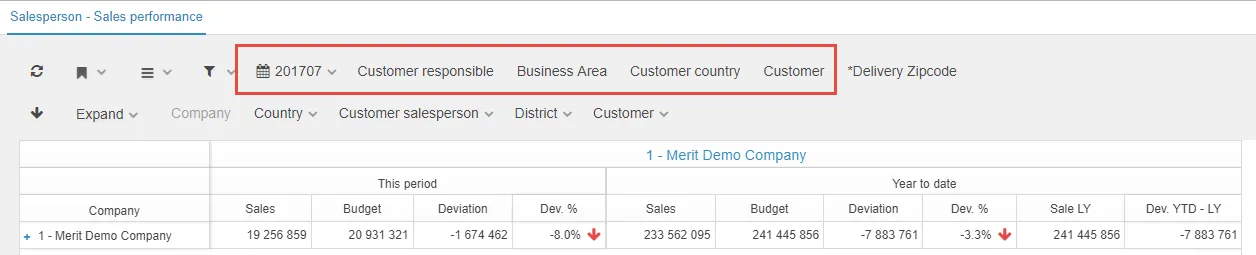
All dimensions added to the datasource are available to set as page filters. This can be done in the tab page filter when you are in edit report mode.
Filter
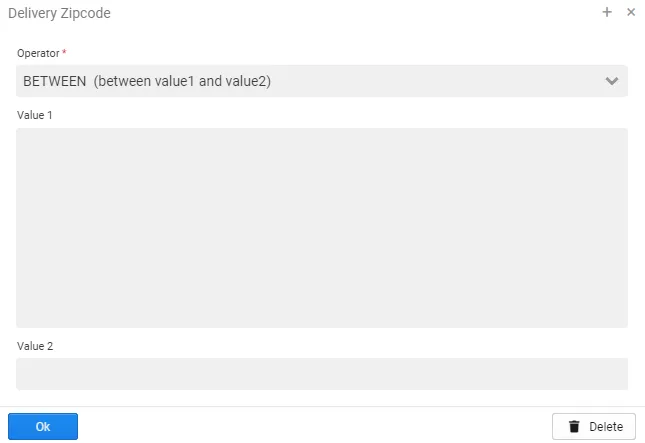
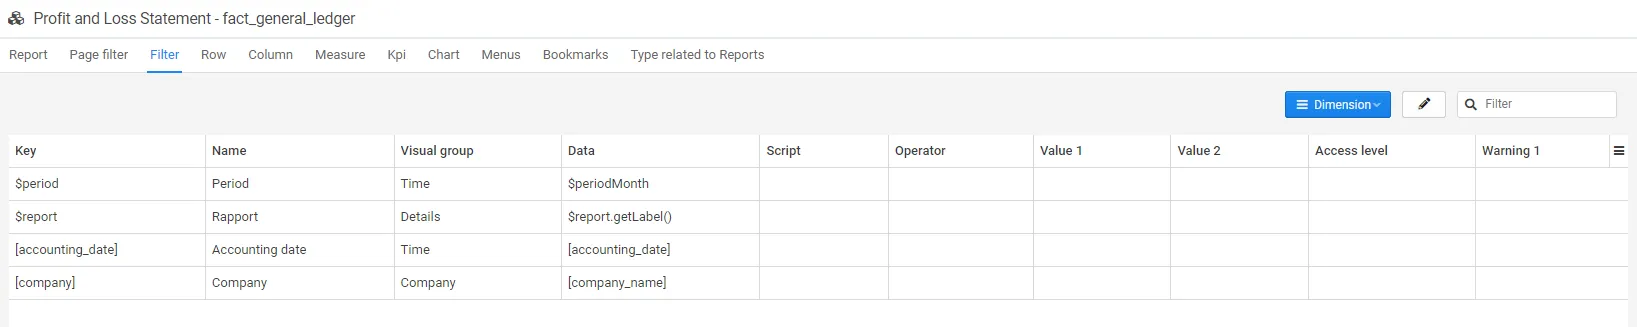
Section titled “Filter”Filters can be used to add quick access to filters which are frequently used in the report. In filters, it is possible to use various operators such as between, >, < etc.
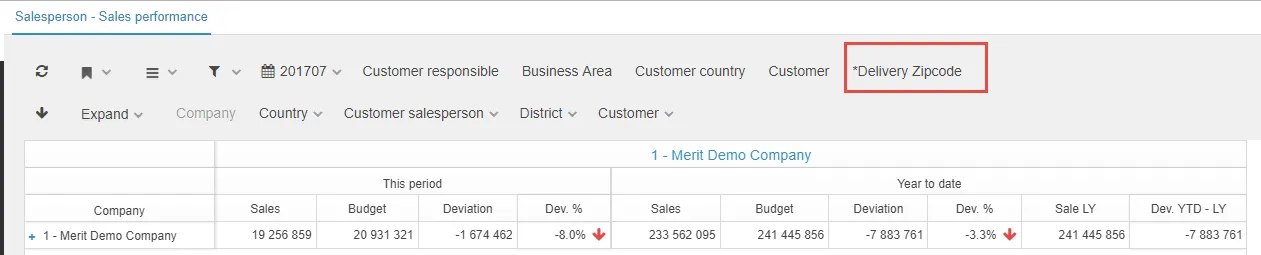
All dimensions added to the data source are available to set as filters. This can be done in the tab filter when you are in edit report mode.
Filter Functions
Section titled “Filter Functions”Filters added to the report are not possible for the user to remove or change. Standard SQL syntax is used (see SQL where clause).
In addition, some parameters in the filter might be scripted. The following expressions are supported:
| Function and script | Description |
|---|---|
$period.getCP(int i) | Returns current period, possible to offset +/- with input integer, 6 digits (‘201810’) |
$period.getCP_LY() | Returns current period last year, 6 digits (‘201710’) |
$period.getCP_LYTD() | Returns periods LYTD, to be used with IN operator: (‘201801’,‘201802’) |
$period.getCP_YTD() | Returns periods YTD, to be used with IN operator: (‘201801’,‘201802’,‘201803’,‘201804’) |
$period.getCurrentDate() | Returns the local date (‘20181016’) |
$period.getPeriod() | Returns the current period as integer, 6 digits (week or month based on the settings in $period.setMode()) (‘201847’) |
$period.getPeriodStr() | Returns the current period as string, 2 characters (‘01’) (week or month based on the settings in $period.setMode()) |
$period.getQuarter(int i) | Returns a quarter, can be offset by adding +/- offset, -1 returns previous quarter. 6 digits (‘201803’) |
$period.getTerial(int i) | Returns a financial terial, can be offset by adding +/- offset, -1 returns previous terial. (‘201802’) |
$period.getType() | Returns TYPE_MONTH(month) or TYPE_WEEK(week) |
$period.getYear(int i) | Returns this periods year, can be offset by adding +/- offset, -1 returns previous year. (‘2018’) |
In reports, you can set a standard drill path.
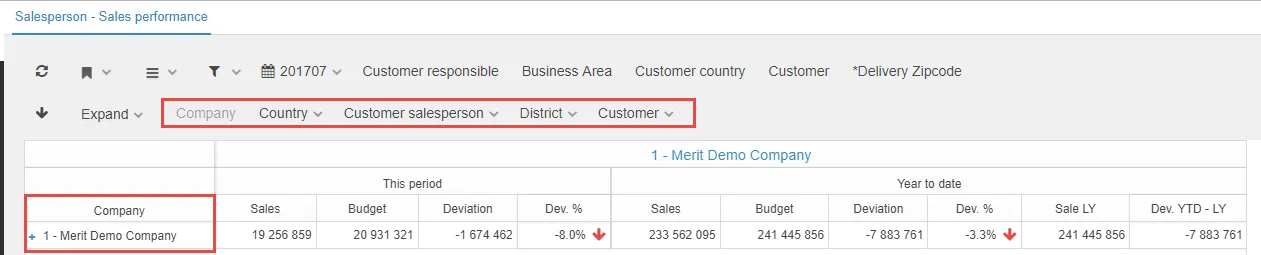
All dimensions added to the data source are available to set as rows. This can be done in the tab row when you are in edit report mode.
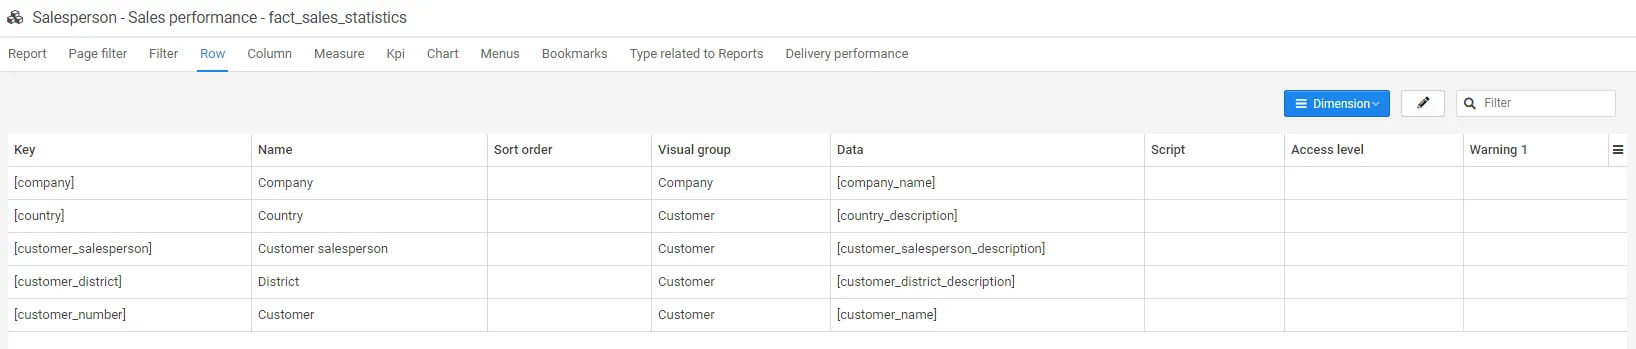
Sorting of the dimension is possible.
Column
Section titled “Column”In reports, you can set a standard drill path also on the x-direction.

All dimensions added to the data source are available to set as columns, but company and period is often used. This can be done in the tab column when you are in edit report mode.
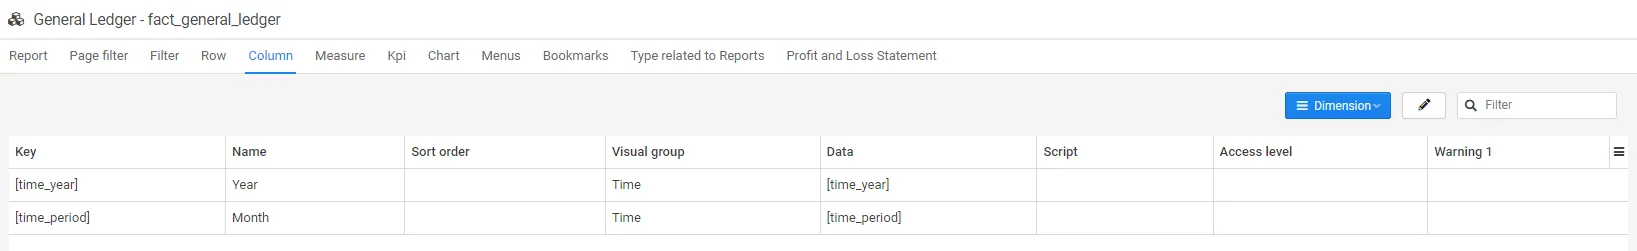
Sorting of the dimension is possible.
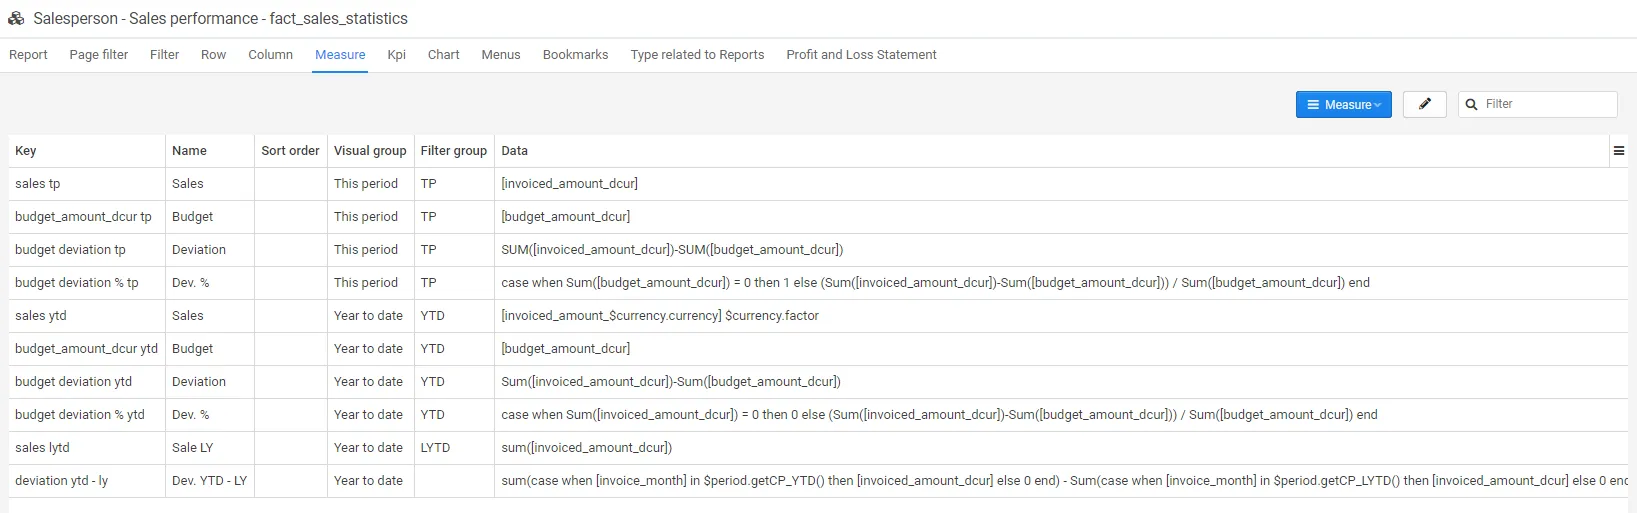
Measure
Section titled “Measure”All measures added to the data source are available to set as measures. This can be done in the tab measure when you are in edit report mode. Regarding how to create a measure in the data source, see the Measure documentation.

In the menu tab the report is connected to a menu point in addition to which role(s) should have access to the report.
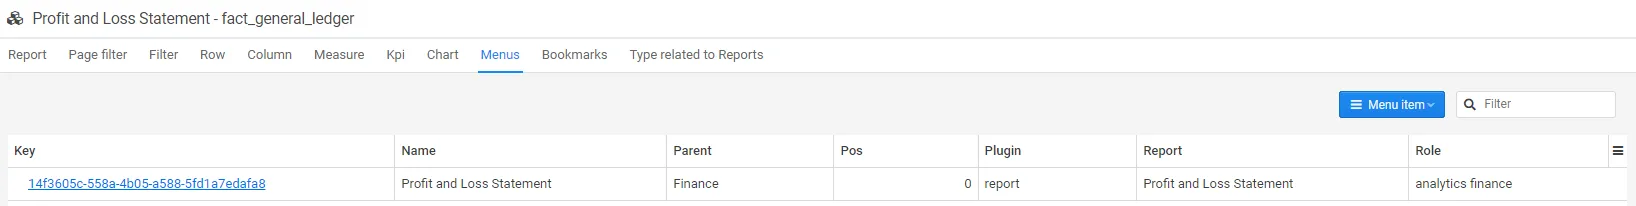
Several roles can be selected.

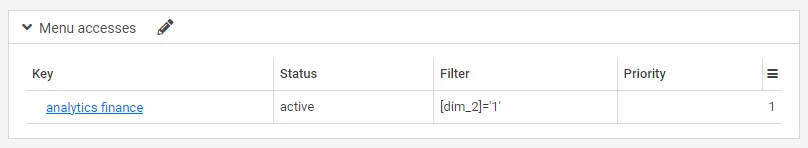
In the menu access section, you get an overview of which menu points the report is connected to. This is also where filters related to which access the various roles should have to the report is set. In the example below, the users have access to all data.

When a filter is set on the user role as below, the user will only see data specified by the filter.
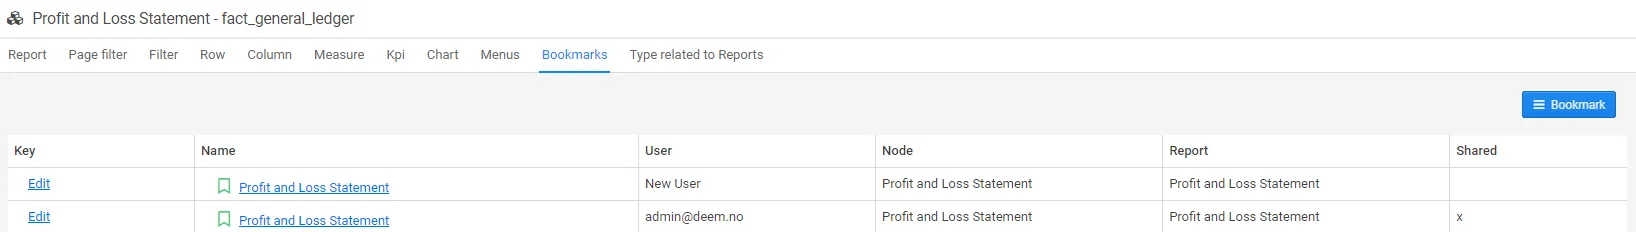
Bookmarks
Section titled “Bookmarks”The bookmarks tab is an overview of existing bookmarks related to the report. For more information regarding how to set up bookmarks, please see the user bookmark documentation and bookmark administration documentation.
Type Related to Report
Section titled “Type Related to Report”Deem Insight can be used to connect several reports from various business areas and link and filter them to the different CLM parts as e.g. account, project. The example below is related to user request.
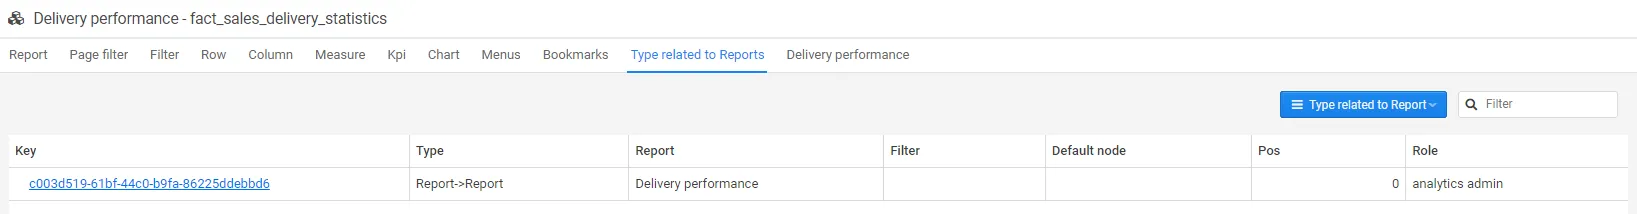
More information regarding type related to report can be found in the type related to reports documentation.
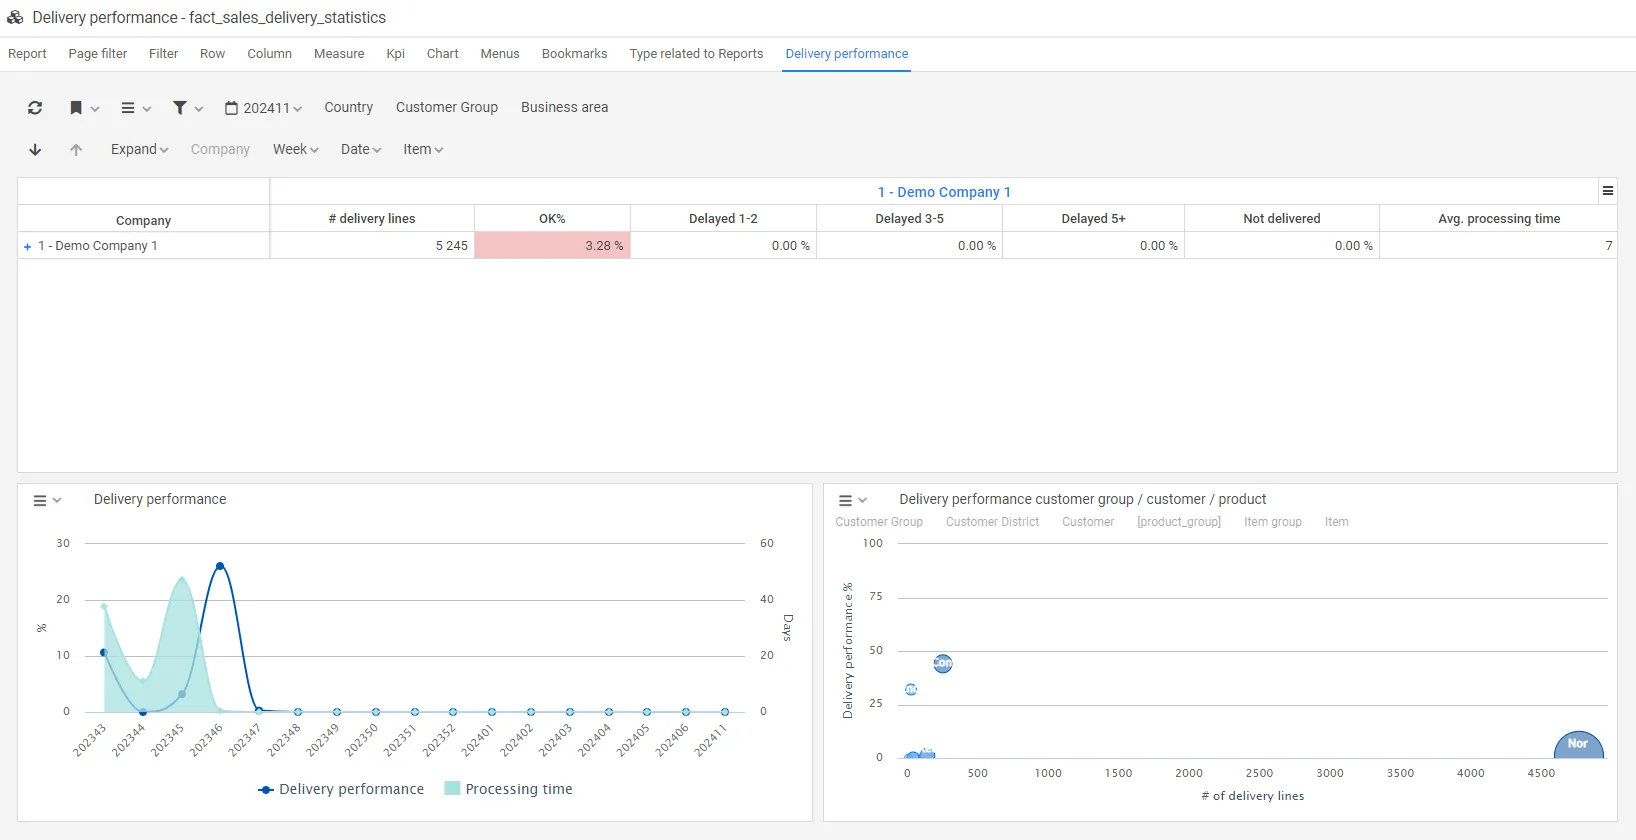
Delivery Performance
Section titled “Delivery Performance”In this tab the user statistics for the selected report is shown.
Report Scripts
Section titled “Report Scripts”Report scripts are used to further enhance the user experience. We can divide the scripting options into 2 areas:
- Manipulate behavior: Control filters, drill, etc.
- Add graphical elements: Graphs and KPIs (described in following chapters)
Core Report Scripts
Section titled “Core Report Scripts”| Function/script | Description |
|---|---|
$olap.setFontSize("x-small") | Override the default report font size, options: xx-small, x-small, small, medium, large, x-large, xx-large |
$olap.setLastUpdatedField("[_created_]") | Shows when the data is last updated. The field created must exist in the data source |
$olap.setShowLastUpdated(0,"[_created_]") | 1: show last updated, 0: hide last updated, field to use |
$olap.setLinkScript("[dimension_key]",position,"document=XXX;key={0};tab=opportunity","Link title","target") | Adds clickable links to dimensions. See examples below |
$olap.setMaxRows(1000) | Override the default number (5000) of rows to be returned |
$olap.setNumberOfKpiRows(int) | Override the default number (1) of KPI rows to be displayed |
$olap.setOpenLevelY(2) | Override the report setting of rows to be opened |
$olap.setShowGraph(0) | 1: show graph, 0: hide graph |
$olap.setShowLevels(0) | Select how to show levels in report: 0 = Show the lowest level and history, n (1..98) = number of levels, 99 = show all |
$olap.setShowSelectX(0) | Turn on/off X-dim 1: show / 0: hide |
$olap.setShowSelectY(0) | Turn on/off Y-dim 1: show / 0: hide |
$olap.setShowTable(0) | Turn on/off Table 1: show / 0: hide |
$olap.setShowToolbar(0) | Turn on/off Toolbar 1: show / 0: hide / 2: show print |
$olap.setShowTotalX(0) | Turn on/off sum on X-axis 1: show / 0: hide |
$olap.setShowVisualGroup(0) | Turn on/off visual groups on measures: 1: show / 0: hide |
$olap.setSkipZeros(0) | Remove rows with only 0/null values: 1: show / 0: hide |
$olap.sortMeasure(0) | Set sort measure, DESC on first measure |
$olap.setFixedColumnWidthLimit(15) | Removes the standard auto adjustments of column width. Deem Insight has an auto adjust of columns set to hit when you reach 15 columns in the report |
$period.setMode('PeriodsInYear', 'Start', 'NoPeriods', 'CurrentPeriod') | $period.setMode('12', '-12', '24', '01') - PeriodsInYear: Terial (2), Quarter (4), Month (12), Week (52). Start: Number of periods available back in time. NoPeriods: Total number of periods available. CurrentPeriod: Usually 01 or blank |
$period.setCP(-1) | Change the default selected period from current period to e.g current period -1 |
$period.setYMD8('20190325') | This function set current period in $period based on a YMD8 formatted date. If $period is set to 12 periods, then $period.setYMD8('20190325') will set $period=201903 |
$report.setCP(-1) | Set current period +/- relative to current period, 6 digits (‘201812’) |
$report.setMode("finance_result") | Set XML report file |
Link Script Examples
Section titled “Link Script Examples”$olap.setLinkScript("[payer_number]",1,"document=Account;key={0};tab=report.payer_info","-> Customer tab ","1");$olap.setLinkScript("[owner_key]",3,"https://www.google.no/q={0}","-> Google search")$olap.setLinkScript("[owner_key]",1,"node=53:18;filter=[owner_key]='{0}'","-> Open opportunities report")$olap.setLinkScript("[owner_key]",2,"report=closedopportunity;filter=[owner_key]='{0}'","-> Closed opportunities report")$olap.setLinkScript('[account_key]',1,'document=Account;key={0};tab=opportunity','-> Account')Link Script Parameters:
[dimension_key]: The dimension to add the link to, use keyposition: The sequence of the link if more than one on the specified keydocument=XXX;key={0};tab=opportunity: The document to link toLink Title: The title to show in the dimension menuTarget: Which field to use in link (0 = key, 1 = name)
User and Context Scripts
Section titled “User and Context Scripts”There are several scripts related to the current user ($user), account ($account), contact ($contact), business unit ($businessUnit), and business area ($businessArea), which can help you filter data. All these can be combined with .getKey, .getName, .getExternalId.
Examples for filtering reports used in CLM:
[payer_number] = '$account_key'[project_number] ='$project_key'[manufacturing_order_number] ='$order_key'
Examples for filtering reports on user:
$user.getBusinessUnit('division', 'key', '[division]')
| Function and script | Description |
|---|---|
$user.getAccount() | Returns current users Account object |
$user.getAccountId() | Returns current users Account Id |
$user.getBusinessArea() | Returns current users Business Area |
$user.getBusinessUnit() | Returns current users Business Unit |
$user.getContact() | Returns current users Contact object |
$user.getContactId() | Returns current users Contact Id |
$user.getEmployeeNo() | Returns current users Employee Number |
$user.getExternalId() | Returns current users External Id |
$user.getId() | Returns current users Id |
$user.getIdAsString() | Returns current users Id as string |
$user.getKey() | Returns current users Key (email) |
$user.getName() | Returns current users Name |
Conditional Scripts (#if)
Section titled “Conditional Scripts (#if)”Scripts to exclude data on sum levels in the report, to control when data is shown. Please note, #if must be included in the script. These scripts can replace intricate case when with count(distinct[])=1 scripts.
| Function and script | Description |
|---|---|
#if ($olap.isCurrentDim('[sales_id]')) max([sales_id]) #else '-' #end | Can be used in the data field on the measure. Will only display data on the dimension set in the script |
#if ($olap.isDimUsed('[sales_id]')) max([sales_id]) #else '-' #end | Can be used in the data field on the measure. Will display data on the dimension set in the script and also on lower levels of the data. Supports multiple fields: $olap.isDimUsed('[sales_id],[order_id]') |
Troubleshooting
Section titled “Troubleshooting”Common Issues
Section titled “Common Issues”Report not showing data:
- Check that filters are correctly configured
- Verify that the data source has data for the selected period
- Ensure measures are properly defined
Graphs or KPIs not displaying:
- Verify that
$olap.setShowGraph(1)is set if graphs should be visible - Check that graph/KPI scripts are correctly formatted
- Ensure data source contains the required columns
Performance issues:
- Use
$olap.setMaxRows()to limit the number of rows returned - Add appropriate filters to reduce data volume
- Consider using
$olap.setSkipZeros(1)to hide empty rows
Q: What is the difference between periodic and all data reports?
A: Periodic reports require period selection in filters and periodic grouping of measures (YTD, TP, etc.). All data reports have no specific requirements.
Q: Can I edit a measure without affecting other reports?
A: No, measures are global. Editing a measure will affect all reports where it is used.
Q: How do I add links to dimensions?
A: Use $olap.setLinkScript() with the dimension key, position, URL pattern, link title, and target field.
Q: Can I use comments in scripts?
A: No, do not place comments (e.g., //) inside methods, as this will cause them to silently fail.
Related
Section titled “Related”- Dashboard Scripts - Layout and positioning scripts
- Graphs - Adding graphs to reports
- Tables - Adding tables to reports
- KPIs - Adding KPIs to reports